The Global Energy and Emissions Footprint of AI Diffusion
The Impact of AI on Global Energy, Emissions, Water Use, and More


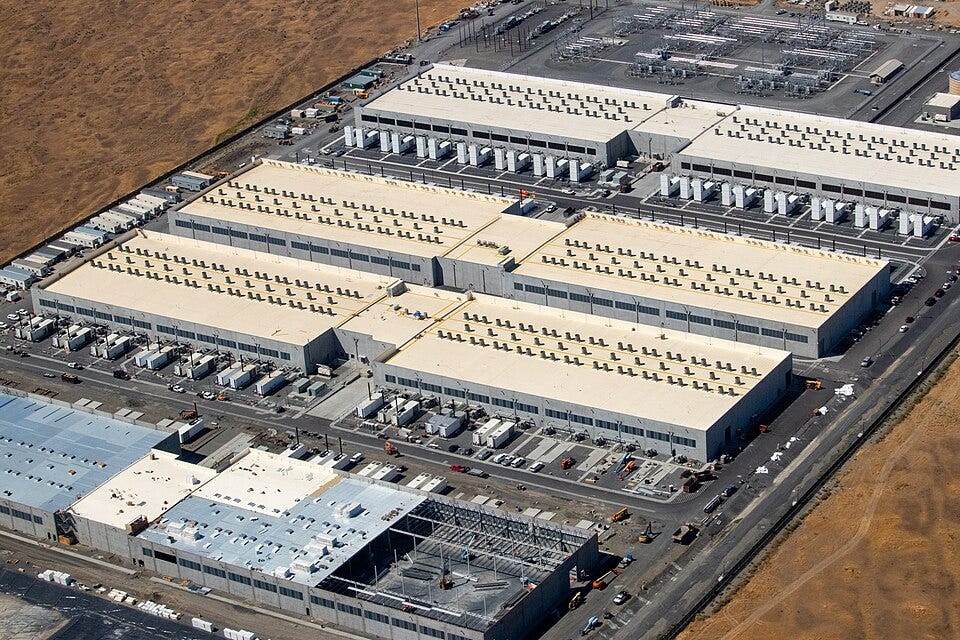
The rise of AI is a revolutionary moment for global energy networks and supply chains. The growth of the AI industry has been so rapid and intense that analysts are falling over themselves trying to publish one shocking forecast after another. An IMF study from 2025 estimated that AI-driven annual electricity consumption could reach something like 1,500 TWh by 2030, equivalent to the current consumption of India, a country of 1.4 billion people.1 Global consulting management firm McKinsey thinks it could go even higher, above 2,000 TWh.2 This global diffusion shockwave is being fueled by a historic and unprecedented infrastructure boom in data centers, power plants, water reclamation facilities, semiconductor fabrication plants (fabs), electrical substations, transmission networks, robotic-centric warehouses, and so much more (see Figure 1). Data centers first proliferated with the cloud computing boom of the 2000s and 2010s, as many corporations shifted from on-site data warehouses to the cloud with the goal of reducing costs and increasing efficiency. But the Gen AI wave that followed the rollout of ChatGPT in 2022 has produced an incredible surge of new data center construction and a nexus of supporting infrastructure. Although a groundswell of local opposition is indeed building up against the AI buildout, the world's ruling classes have become fixated on a simple formula: energy first, questions later. Despite ample debate over the energy, environmental, and material impacts of the AI boom, we still lack any rigorous, sober assessments that account for the complex lifecycle dynamics of AI diffusion on a global basis.
And so that's the main goal of this post: to tell the story of AI and energy on a global scale, to cast the net further out than any other analysis has done before. AI systems like Gemini and ChatGPT consume vast amounts of electricity, but building out the AI universe implicates energy networks and supply chains throughout the world. The rise of AI is certainly an electricity story, but it's also a story about energy, water, metals, materials, and thermodynamics. Steel and cement have to be produced to construct data centers. Fiber optic cables need to be laid down to relay data and information from data centers to businesses and consumers. Computer chips need to be manufactured with some of the most advanced machines human beings have ever designed. And these machines are so delicate and complex that they have to be disassembled when shipped and reassembled very carefully on-site. The Dutch semiconductor giant ASML ships hundreds of advanced lithography machines every single year. For a single Extreme Ultraviolet (EUV) machine, it takes ASML on average 3 cargo planes, 40 freight containers, and 20 trucks to ship the disassembled components to Taiwan Semiconductor Manufacturing Company (TSMC) in Taiwan, which uses these devices to produce the world’s most advanced chips.3 Taiwan’s electrical grid is dominated by coal and natural gas, and since TSMC alone consumes roughly 10% of the island’s electricity, the semiconductor industry in Taiwan is very carbon-intensive.4
These issues led us to begin asking about specifics and to conduct the necessary research to answer some major questions. How much energy is humanity using from the widespread adoption and diffusion of AI systems in the global economy? What share of global energy consumption in 2026 should be attributed to AI? What counts as an AI system in the first place? What amount of global greenhouse gas (GHG) emissions are produced from AI adoption and diffusion? How is the rise of AI affecting global energy networks and industrial supply chains? Where is all of this energy expansion going, and what effects could it have on the planetary biosphere over the following decade?
This is the first quantitative analysis we are aware of that attempts to unpack the global energy and emissions footprint of AI diffusion for a single year (2026), as well as to provide the evidence and context necessary for a comprehensive lifecycle analysis. Research studies on AI and energy are legion, but as we'll shortly see, they are usually restricted to various pieces of the larger puzzle without putting it all together. This piece will emphasize the lifecycle impacts of AI diffusion on a global scale. When researchers calculate the water footprint of beef, they don’t stop at the water consumed at the local McDonald’s. They look at the water used to raise the cow, the water used to grow the crops that feed the cow, and other parts of the supply chain, from which they conclude that 98% of the water footprint of meat products can be attributed to the water used for growing animal feed.5 They perform similar analyses if they want to calculate the emissions footprint of coal-fired plants or renewable energy technologies. The AI industry should be no different, yet too often public and academic discourse on the subject can feel like a haphazard caricature of what's actually happening.
That’s because AI is often seen as a product instead of an industry by many academic researchers and the general public. Products are spatially localized and isolated. The burger is right here in your hands. ChatGPT sends you a personal answer straight to your device. When all you see is isolated and disconnected units, the resulting consequences also look small and isolated almost by definition. But when you shift perspective and see AI as a global industry, you start to realize that it has interdependent supply chains, economies of scale, network effects, technological integration, and industrial agglomeration. Now it’s no longer an isolated thing. It’s a global megamachine devouring everything in its path. Precisely because AI is actually an industry with a broad range of products and services, we can subject it to the same kind of lifecycle analysis used for other industries.
The AI industry has an enormous environmental footprint that can be described through two basic components: operational and embodied. Operational emissions are the GHG emissions that result directly from the electricity consumed by AI systems for training, inferencing, or any other regular operations. By contrast, embodied emissions are all the lifecycle emissions produced from the manufacturing, transportation, construction, installation, recycling, and decommissioning of the physical hardware and infrastructure that support the broader cloud ecosystem, including activities like smelting steel, mixing concrete, cleaning silicon wafers, and so much more. Likewise, energy consumption can also be described in operational and embodied terms.
Tech companies and tech-friendly researchers have traditionally focused on operational carbon and energy consumption because they’re easy to measure and even easier to obscure through carbon offsets, credits, and other greenwashing mechanisms that do practically nothing to address the fundamental ecological issues resulting from the global AI rollout, including enormous water consumption and radical land use changes with far-reaching implications.6 As this analysis will show, the operational carbon and energy of AI electricity use are merely one significant piece of a much larger puzzle. The real impact is both upstream and downstream from on-site operations, from all the global supply chains that are furiously churning out the computing hardware and physical infrastructure that form the foundations of AI deployment to the rebound effects and downstream consequences on households, corporations, and governments that are using AI systems at unprecedented rates.
We use the term “shockwave” to emphasize the enormous levels of investment that are fueling the expansion and diffusion of AI technologies. We make no claims here as to whether the technologies themselves are impressive or revolutionary. Technologies can spread for all kinds of reasons, sometimes because they truly are revolutionary and other times because they are merely imposed on society by the ruling classes. There are features of AI models which are no doubt impressive and will change the nature of work and human society more broadly, but at the same time, these models also have fundamental weaknesses or potential issues that may limit their diffusion and universality going forward, including hallucinations, data walls, abstraction barriers, and many more.7 In any case, this piece doesn’t focus on the pros and cons of AI adoption. Its main focus is strictly on energy and emissions accounting, to give the public and researchers a better sense of the scale and scope of AI diffusion and the strains that it’s putting on the planet’s resources. The authors of this piece both believe that the financial speculation around the AI industry has become a bubble, and that, like all prior bubbles, this one too will end, and the scale of global investments will fall precipitously as a result. But when that might happen and what impact it could have on this assessment are also beyond the scope of this piece.
In 2026, our analysis finds that AI diffusion and deployment is responsible for as much as 1.1% of all global energy demand, substantially higher than what most naïve conventional estimates suggest. For example, a simplistic analysis from Our World in Data claims that AI diffusion accounts for only 0.2% of global primary energy demand.8 As we argue comprehensively in this piece, these kinds of assessments are generally less useful because they’re focused purely on electricity consumption and ignore the broader lifecycle energy dynamics powering AI diffusion globally. In reality, we show that AI-driven global energy use is likely already higher than the energy consumption of the entire United Kingdom. We also estimate that AI will be responsible for roughly 1.2% of all global GHG emissions for this year. These are stunning figures that undercut the typical narratives about the relative insignificance of AI on global energy consumption.
We do not claim that the results presented here are the final or definitive answers to the questions we have posed. In fact, we want to openly acknowledge right from the start that our methodology and calculations, presented in detail below, contain various flaws, omissions, and simplifying assumptions, almost all of which are necessary given the scope of this analysis and the corresponding data limitations. These issues will be discussed in detail, so we aim to spare our critics a great deal of wasted ink. The results in this analysis should be treated as a first-order approximation and as a gateway to further research and investigation, so that detailed second-order and third-order assessments can arrive at more precise answers in the future.
The amount of work that remains to be done in this area is quite vast. Our main objectives for this piece are as follows.
We want to spark a shift in the way regular people, academic researchers, large corporations, and governments talk about AI and its impact on energy consumption, GHG emissions, and the planetary biosphere. That means first and foremost explaining how current narratives are woefully inadequate and subsequently offering better alternatives for how to think about the issues we’re facing.
We hope to spur continued research in this area so that other groups may arrive at better answers than what we’ve presented here.
We hope this piece can serve as a reference frame for future political action to assert greater public and democratic control over the scope, scale, and speed of the AI diffusion shockwave now gripping much of the world.
AI and Energy: An Introduction
The term “Artificial Intelligence” evokes many opinions and interpretations. The first starting point of this analysis is to determine what we mean by AI. In this context, we define AI as any generative, agentic, software, or robotic system partly or entirely based on classical symbolic logic (like computer vision, geometric pattern matching, etc), deep learning with neural networks, or some combination of the two. What’s excluded under this definition are models, systems, and processes based on things like logistic regression, random forests, or gradient boosting. What’s included in this definition are Large Language Models (LLMs) like ChatGPT, Claude, Copilot, and Gemini, but also AI agents, self-driving vehicles, industrial robots, autonomous robots, enterprise decisioning software, like clinical decision support systems in hospitals, and so much more. In plain English: if you depend on symbolic logic or neural networks in any way, you are classified as AI for the purposes of this analysis. Philosophical discussions about what constitutes intelligence and whether LLMs or AI agents are actually conscious or intellectual beings are beyond the scope of this analysis.
Most users interface with AI systems and usually ignore all the background conditions necessary for their creation. But before any AI model or system can be deployed, it has to be trained and developed. That requires storing vast quantities of data on the cloud. It requires deploying specialized equipment like graphics processing units (GPUs), accelerators, memory chips, server racks, network switches, optical transceivers, fiber optic cables, chillers, cooling towers, and so much more. To facilitate the demands of high-performance AI computing, thousands of GPUs are linked together to function as a de facto supercomputer, often supported by High Bandwidth Memory (HBM) chips that are vertically stacked right next to the GPUs. The GPUs receive inputs and instructions from the outside world and then use them to perform rapid calculations, in the form of matrix multiplications that implement the neural network architectures at the heart of modern AI systems (see Figure 2). All of these things have to be manufactured, transported, installed, repaired, and continuously operationalized to ensure they can properly support AI diffusion and deployment. And once AI models are trained and deployed, users send queries and prompts as inputs and receive various outputs, from written text and diagrams to images and videos.

Emma Strubell and her collaborators published a major paper in 2019 that brought to the world’s attention the energy-ravenous AI models under development at the time.9 For example, the paper concluded that training an early AI model with a neural architecture search methodology would emit the equivalent of 600,000 pounds of carbon dioxide, roughly what 30,000 cars in the US release in a single day under typical driving conditions. Although the paper was groundbreaking, it began the unfortunate trend of analyzing AI energy demand largely through the prism of operational electricity consumption, a trend that has persisted with many of the latest research studies, from which we get trivia-level facts like “training OpenAI’s GPT-4 took over $100 million and consumed 50 gigawatt-hours of energy, enough to power San Francisco for three days.”10 The push to analyze operational demands and capacity meant that most of the academic literature on the subject has largely ignored lifecycle dynamics, such as the upstream and downstream processes affected by AI deployment. Everyone has heard by now that a typical ChatGPT query can consume up to ten times more electricity than a regular Google search.11 But electricity consumption is only one angle of this story, and not even the most important one.
Udit Gupta and his collaborators challenged the focus on operational consumption in a groundbreaking 2021 paper which demonstrated that embodied emissions vastly exceed operational emissions for modern computing systems.12 There have been several studies examining the lifecycle links between AI models and energy and emissions. Sasha Luccioni and her team estimated the total lifecycle emissions of training the AI model BLOOM in a 2022 paper.13 Confirming the results from Gupta and others, the researchers showed that the embodied carbon of the computing hardware swelled beyond the operational emissions from training the model itself.
In a famous 2023 paper, Alex de Vries showed that the inferencing requirements of AI would soon dwarf the electricity consumption used for training.14 The paper modeled several future scenarios of electricity consumption, with a worst-case scenario in the near term showing Google’s electricity consumption ballooning to the same level as that of Ireland. However, the analysis only focused on electricity consumption and ignored the network effects and lifecycle dynamics of AI deployment. Other researchers have shown that AI systems can have radically different emissions footprints depending on where, when, and how they’re executed, especially when they lack sufficient battery storage and have variabilities from wind and solar power.15 For example, certain AI workloads could be transmitted to data centers powered by renewables, thus lowering their emissions.
Data centers and other AI infrastructure are fundamentally built on critical minerals and raw materials extracted from the Earth. Copper is used for wiring, lithium is used for batteries, and rare earth elements go into industrial magnets that are used for cooling fans and hard drives. All these critical minerals and elements are sourced from a variety of entangled and extractive global supply chains.16 The mining operations required to obtain these raw materials have a significant emissions footprint, as they end up destroying local carbon sinks and landscapes, not to mention the operational emissions from running gigantic diesel-powered vehicles and machines, like rotary blast drills. Processing a single ton of rare earth metals produces roughly 2,000 tons of toxic waste.17 In Baotou, China, a massive lake of toxic sludge emerged over the years from all the rare earths processing, ruining local water quality and devastating local communities.
The semiconductor industry is the beating heart of the data center buildout. Semiconductors are made in fabrication plants, or fabs. Many companies that are considered semiconductor companies don’t actually build their own chips or devices. Instead, they outsource production to third-party manufacturers. The most dominant semiconductor manufacturer in the world is Taiwan Semiconductor Manufacturing Company (TSMC). TSMC operates on a foundry business model, meaning they don’t design anything; they only build the physical devices and components. Other companies, like NVIDIA or AMD, are software companies that do the design work and then send the designs to TSMC so it can produce the corresponding chips. In a literal sense, TSMC is a chipmaker and a company like NVIDIA is a chip designer.
And these companies are barely scratching the surface of the semiconductor industry. Microchips are made through a very complex process involving steps like etching, photolithography, deposition, testing, and assembly, all of which require some of the most advanced manufacturing machines and devices human beings have ever made. The Dutch company ASML manufactures the world’s most advanced lithography machines, which use advanced sensors and lasers to etch complex patterns on silicon wafers. Applied Materials produces some of the world’s most advanced deposition systems. These AI chips are further supported by a physical ecosystem of server racks, network switches, optical transceiver, cooling systems, and fiber optic cables (see Figure 3). The server racks themselves require large amounts of steel and aluminum, both of which are built from energy-intensive industries that emit vast quantities of carbon dioxide.
In 2023, US data centers comprised about 4.4% of national electricity consumption, or 180 TWh, roughly as much as all of Thailand and about four times as much as New York City.18 Back in 2000, they only consumed 0.1% of total electricity consumption, so their share of national electricity consumption has risen by 4000% in under 25 years.19 In other countries, the data center share of national electricity consumption is even higher; they were responsible for over 10% of Ireland’s total power output in 2021, and are now likely hovering around 20% of total Irish power consumption.20
Let’s take a moment to explain our approach to units in this analysis. The most common unit we use is the terawatt-hour (TWh), a unit of energy. For perspective, 1 TWh of energy can power roughly 100,000 average American households for a year. We’ll also make reference to other units depending on what’s used in the original sources we cite, such as megajoules (MJ) or exajoules (EJ), which are both units of energy. We’ll also use units like the gigawatt (GW), a unit of power. Power is just energy per unit of time. For context, 1 GW of power capacity can cover the consumption of roughly 750,000 US households, though it can go up to almost 1 million in certain circumstances.21 Because we use so many different kinds of units, we’ll be converting back and forth many times among these units. The goal of this analysis is to keep the math and the equations to a minimum, so we won’t really show all the conversion steps involved.
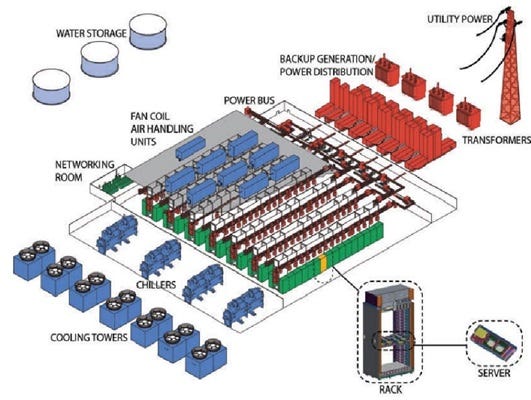
Data center efficiency has increased substantially over time. The Power Usage Effectiveness (PUE) tracks the total energy consumed by a data center divided by the energy consumed by its computing equipment. It’s always going to be above 1 by definition, and the closer it is to 1, the more efficient the data center is considered to be. About 15 years ago, data center PUE stood at an average of around 2.22 Today, leading hyperscale sites often achieve 1.1-1.2, while broader fleet averages are closer to 1.4-1.6, thus representing a major gain in average efficiency.23 This efficiency boost was part of a broader trend in computing captured by Koomey’s Law, the observation that the number of computations per joule of energy dissipated has doubled roughly every two years.
Despite this incredible rise in efficiency, total electricity consumption from data centers has skyrocketed, as we explained above. It’s a canonical example of the Jevons Paradox at play. Named after British economist William Stanley Jevons, who observed in the 19th century that aggregate coal consumption kept rising in Britain even as steam engines were getting more efficient, the paradox states that the more efficient industrial and technological systems become under capitalism, the more energy they consume as production costs decline, products become cheaper or cost-effective, and demand rises as a result. The empirical evidence for it is overwhelming.24 Beyond just data centers, one can find numerous examples of it in modern history. Steel production ballooned after the Bessemer process made it more efficient to make steel.25 Fertilizer production skyrocketed after the Haber-Bosch process made it vastly more efficient to produce ammonia.26 Water consumption in global agriculture went through the roof in the late 20th century with the introduction of more efficient irrigation methods.27 The list goes on and on. As explained in The Physics of Capitalism, and in this post, technological change under capitalism is often channeled towards expanding exergy, the maximum useful work that can be extracted from a system as it reaches equilibrium with its surroundings. In other words, capitalists are routinely looking to expand the scale of the energy system by building more energy-intensive devices, then they exploit any resulting efficiency gains to drive more production and consumption, as the whole system is structurally oriented towards biophysical growth.
It’s easy to see this phenomenon at the device level as well. A typical Hopper AI chip from NVIDIA consumes roughly 700W.28 The next-generation Blackwell chip is far more efficient, in the sense that it can perform more calculations for every unit of energy consumed, but it also operates at about 1200W.29 Newer chips like Rubin will be even more efficient, but that will still likely lead to greater adoption and diffusion, and therefore energy consumption. AI chips might be getting more efficient, but they’re also getting more energy-intensive at the unit level.30 This is what happened with steam engines during the Industrial Revolution as well (see the post above and also this post for more details). Early steam engines could generate far less mechanical energy than later versions, so not only did they get more efficient, they also got bigger, more complex, and more energy-intensive.
Complex systems can expand in scale because they become more efficient, but it can also be the case that exogenous shocks to their energy scale can force or incentivize system components into becoming more efficient. These are some of the same dynamics driving the AI infrastructure buildout worldwide: the push for better is coinciding with a push for bigger, including bigger chips, bigger robots, hyperscale data centers, and so on. This infrastructure frenzy is also partly driven by the so-called AI scaling laws, which have convinced much of the tech world that throwing more data and more computing resources at neural networks will significantly improve their performance over time.31 One of the great unknowns for the future of the AI infrastructure buildout is in what direction the tech industry will travel if these scaling laws start hitting insurmountable barriers and limits. One of the most constrained biophysical inputs for the AI industry is water, but it’s also one of the most misunderstood topics in the broader AI energy story, so we need to develop a clear understanding of how it fits with everything else.
AI and the Heat-Water Nexus
This section is about water and heat and how they’re related to energy production for AI. But although water and electricity get the bulk of the attention, heat is perhaps the most important aspect of the AI energy story. Many data centers get their electricity from power plants burning fossil fuels, like coal and natural gas. It turns out, however, that the electricity produced by coal and gas plants is less than 40% of the total energy unleashed from burning fossil fuels. The rest of the energy is waste heat dumped into the external environment. The laws of thermodynamics imply that no real-world heat engine can convert heat to mechanical work with 100% efficiency, so some waste heat must always be rejected to a cooler external environment.
When fossil fuels are burned in a power plant, they convert water into hot and pressurized steam, which is then used to drive a turbine that produces electricity. The steam then needs to be cooled down and converted back to a liquid, so it can be recycled and reused for the next cycle starting in the boiler. But that heat carried by the steam has to be removed from the plant somehow, and the cooling loop performing that task is responsible for the vast majority of water consumption at power plants. Most power plants in the United States now deploy water-intensive recirculating systems that evaporate much of the water they withdraw from local watersheds straight into the atmosphere.32 The United States Geological Survey estimated in 2019 that roughly 57% of water withdrawals from recirculating systems are evaporated and consumed.33
Computing equipment in data centers can get really hot because of Joule heating (or resistive heating), which is the heat that’s generated when an electric current passes through a conductor. Since transistors are basically just electrical on-off switches, they collectively generate vast quantities of heat and run the risk of causing major malfunctions. As a result, this heat needs to be removed from the servers inside the data center, and many methods have been developed to do precisely that. For most of their history, data centers relied on air-powered cooling systems, either giant fans blowing air across the server hall or industrial-grade AC units blowing in cool air through large vents. But with the rise of cloud computing and generative AI, more and more data centers have shifted towards liquid-powered cooling systems, which are more efficient at removing heat than their air-powered counterparts.34
The most popular methods of heat rejection among liquid-powered systems are evaporative cooling and adiabatic cooling. They both exploit a crucial fact about the phase change of water: when water transitions from a liquid state to a gas state, it absorbs energy from the surroundings. It’s the same basic principle behind sweating on a hot summer day: as the sweat evaporates from your skin, it absorbs heat and helps keep your body cool. In evaporative cooling, the water collects the heat from the servers inside the data center and is then sent to the cooling towers outside the data center. Some of this hot water is then sprayed and exposed to the air, thus evaporating and absorbing heat from its immediate surroundings. The cooler water is then relayed back into the data center to start another cooling cycle. On particularly hot days with excess moisture, many data centers will resort to mechanical refrigeration with chillers instead of evaporative “free cooling.”
Evaporative cooling requires large quantities of operational water consumption, and so many data centers rely on adiabatic cooling to conserve water for their on-site operations. In adiabatic cooling systems, air is the primary method of heat rejection, not water. But water may be used to cool down the air on very hot summer days, when the incoming air is obviously insufficient to actually cool down the cooling fluid. What happens at a mechanical level is that the air is pushed through water pads that spray the hot air. As the sprayed water evaporates, it absorbs heat and cools down the air, which is finally blown across the sealed coils containing the cooling fluid. The water and the air never touch the sealed cooling fluid in this method. In thermodynamics, an adiabatic process is one where there is no net heat exchange between a system and its surroundings, and so this cooling process is called adiabatic because the total enthalpy (heat content) of the air-water mixture remains constant. The heat is simply shifted from one source to another.
Adiabatic cooling methods are becoming increasingly popular because their closed-loop setup allows hyperscalers to claim that they’re taking water conservation seriously, but the problem is that the fans doing much of the cooling need electricity to keep running, and research has shown that the indirect water footprint associated with that electricity generation can be far bigger than the on-site water consumption itself.35 Many adiabatic and dry cycle cooling methods are therefore unlikely to resolve the fundamental water consumption and conservations issues related to the AI infrastructure boom.
Training AI models requires large quantities of water. Researchers have estimated that training OpenAI’s GPT-3 in Microsoft data centers directly consumed roughly 185,000 gallons of water, and that figure balloons to 1.4 million gallons of water once the total water footprint is included, equivalent to the daily water consumption of roughly 14,000 Americans.36 But as AI scales globally across different industries, it’s inferencing for regular tasks, queries, and prompts that will comprise the greatest share of its global water footprint.
The direct operational water footprint of a typical data center is nothing astonishing on most days, but it can rise dramatically during hot summer days, straining local water resources severely. A major problem with evaporative cooling methods is that they simply expel and evaporate vast quantities of water, permanently removing a precious resource from local watersheds.37 Plenty of other industries directly consume more water than data centers, but many of these industries, like agriculture, return much of the water they initially consumed back to local watersheds. Data centers are a major reason why water utility bills are rising across much of the United States.38 With looming political and resource problems down the road, some hyperscalers have started building water reclamation facilities to reuse wastewater for cooling data centers instead of discharging it to local rivers and other habitats. In Douglas County, Georgia, Google’s data center campus gets over 95% of its cooling water from non-potable water treated at water reclamation facilities that were financed by Google itself.39 But for all the real problems with their direct operational water footprint, by far the biggest problems lie upstream, with the indirect and lifecycle demands that are necessary to keep data centers running in the first place.
In 2021, researchers estimated that roughly 75% of a data center’s water footprint was indirect, meaning that most of the water consumption attributed to data centers went towards generating the electricity required to power the data center.40 The vast majority of the electricity came from coal, gas, and nuclear plants. However, once chip and device manufacturing are taken into account, that share rises to well over 90%. In other words, the vast majority of the water consumption required to create and maintain a data center is either indirect or embodied. It’s absolutely fair to say that the water used to cool down a typical data center in the first place is mostly trivial in the grand scheme of things. But once the lifecycle consumption analysis comes into the picture, the total water footprint of a typical data center becomes enormous.
For perspective, the total water footprint of data centers in the United States had already surpassed the entire global water footprint of Coca-Cola in the mid-2010s.41 As of this publication, in the summer of 2026, it’s almost certainly the case that US data centers have a vastly bigger water footprint than all US golf courses, which used to outpace them earlier in the decade (see more details below). Given the phenomenal growth rates projected over the next few years, data centers are poised to become one of the dominant water-guzzling industries on the entire planet, potentially even rivaling the entire global agricultural system within a decade unless the AI bubble pops and infrastructure development screeches to a halt.
A few months ago, Anthropic CEO Dario Amodei published an essay called “The Adolescence of Technology.”42 The core theme of his essay—that AI diffusion carries many great risks but that we can keep those risks under control—is not the main focus of this piece. In the essay, Amodei indirectly dismisses ecological and energy-related concerns about AI by suggesting that data center water usage isn’t an actual problem at all; while he doesn’t overtly argue this position himself, he does link to a quantitative analysis by the tech research firm SemiAnalysis.43 In that analysis, the research firm compared the water consumption of Elon Musk’s Colossus 2 in Memphis to the lifecycle water consumption of an In-N-Out Burger joint, concluding that Colossus 2 only consumes as much water as about 2.5 In-N-Out Burger places.
The first facility, Colossus 1, initially consumed about 1 million gallons of water a day.44 The planned capacity might take it up to 5 million gallons of water a day, equivalent to the daily water usage of roughly 10,000 people in the US, or about 3,500 households.45 The facility uses a Supermicro closed loop liquid cooling system for internal servers, but then passes off the heat to an exterior loop that uses evaporative cooling, so much of the water it’s drawing from local Memphis sources doesn’t actually go back to local watersheds.46 However, Colossus 2 is largely powered by aeroderivative gas turbines, which typically don’t consume any water while they’re running.
This comparison from SemiAnalysis is severely flawed on multiple levels. First, the vast majority of data centers in the United States get their power from the regular utility grid, not from aeroderivative gas turbines or diesel generators.47 That means their water footprint is largely indirect. Using Colossus 2 as an example of water efficiency in data centers is therefore a complete red herring, since it’s not actually representative of how most data centers operate. Second, SemiAnalysis was happy to conduct a lifecycle water consumption assessment on the beef used for In-n-Out burgers, but they strangely ignored their own methodology on the other side of the ledger, preferring to look at the operational water consumption for the gas turbines, which conveniently for them happens to be zero. But it obviously takes vast amounts of water to build the gas turbines in the first place. It takes water to extract the raw materials and lots of water is also used in the manufacturing process, among other points in the supply chain.
A typical natural gas generator at Colossus weighs over 200,000 pounds, or roughly 91 metric tons, and there are 46 of them currently operational.48 The dominant structural components by mass are steel and iron, though many other metals, like copper and nickel, are also used in most natural gas generators. Based on manufacturing water inventory data from 2005, we’ll assume a conservative 6 cubic meters of water consumption per metric ton.49 A cubic meter is about 264 gallons, so that translates to 1,585 gallons of consumption per metric ton. The embodied water footprint of a natural gas generator at Colossus is therefore about 144,000 gallons, and the total for all 46 generators comes out to roughly 6.6 million gallons of water. The typical American household consumes 300 gallons of water a day, which on a per capita basis comes out to about 100 gallons a day.50 That means the embodied water footprint of the Colossus gas turbines alone is equivalent to the daily water consumption of almost 70,000 Americans. This analysis, of course, completely leaves out the embodied water footprint of the steel and concrete used in the data center itself, not to mention the enormous embodied water footprint of the computing hardware. Once all of that is factored in, the SemiAnalysis comparisons would look downright ridiculous.
The misconceptions around the true magnitude of data center water consumption appear constantly in popular news sources as well. A recent analysis from CBS News purported to show that many common American economic sectors, like golf courses, consumed more water than American data centers, about 230 billion gallons for the latter compared to 530 billion gallons for the former.51 There were no original insights in this analysis. It was largely a summary of prior research with good-looking charts. The CBS analysis relied on numbers from 2023, which are understandably outdated today. For an industry where the emissions and water footprints are practically doubling every two years, what happened three years ago is ancient history.
The analysis also assumed that the only component of the indirect water footprint is water consumed by power plants to produce the electricity for data centers. In reality, the indirect water footprint is much larger, as it includes water consumed by the semiconductor industry to produce chips and other computing hardware, water consumed by the steel industry to produce the steel for server racks and other infrastructure, water consumed to produce aluminum and other critical metals, and so on. Given some of the projections starting in 2023 contained in the CBS analysis itself, it’s highly likely that the total data center water footprint in the United States will vastly exceed that of golf courses in 2026. Of course, agriculture and some other sectors still consume significantly more water than data centers, as we mentioned earlier. But these sectors are not approaching anything near the astonishing growth rate of data centers, and therefore they don’t have the same level of marginal impact on global ecology. Furthermore, sectors like agriculture and golf courses reclaim large quantities of water. According to the data contained in the CBS report, the 530 billion gallons of annual water consumption attributed to golf courses drops closer to 400 billion gallons once the reclaimed water is included in the analysis. At that level, there is absolutely no contest in 2026 between golf courses and data centers; the latter win easily once their full embodied footprint is included.
This vast water demand puts enormous pressure on local public water utilities, especially since data centers are often geographically concentrated and the local utilities were not built to meet the insane water demands of modern computing networks. For a specific example, consider Loudoun County in Northern Virginia, the global leader in the data center buildout. Loudoun Water is the public utility that serves over 300,000 residents in the county. Researchers have estimated that Loudoun Water would be unable to meet total customer demand on some of the hottest summer days, when data centers need to use more water to keep their systems cool and local facilities may therefore be tempted to turn on evaporative cooling.52
Meeting this growing water demand requires the construction of new pipelines, plants, and infrastructure, which are costs that generally fall on local communities, often through higher water bills. It doesn’t help that many data center companies and hyperscalers often require local governments to sign non-disclosure agreements regarding future energy demands and requirements.53 Many critical details about on-site water usage are never reported, making it difficult for public water utilities to understand just how much water they need to provide and provision. As a result of all this uncertainty, many towns and cities are now fiercely resisting the expansion of data centers into their local communities. Data centers have recently been rejected everywhere from Minnesota to Arizona, with an estimated $130 billion worth of data centers blocked by local communities in Q1 2026.54
One of the world’s major water guzzlers is the semiconductor industry, which consumes vast amounts of water through its fabrication plants. That’s because the silicon wafers that form the basis of all microchips need to be kept extremely clean at all times. Virtually any impurities, even marginal amounts, would sabotage their desired electrical properties. As a result, they’re routinely washed by water at various stages of production. The ultrapure water (UPW) used in modern fabs is produced from extensive filtration systems in municipal water plants. A large fab can gobble up millions of gallons of water in a single day, and almost 4 billions gallons a year.55 When Taiwan experienced a historic drought in 2021, the government had to save the semiconductor industry by practically denying water to nearly all other economic sectors.56 The global semiconductor industry consumes over 260 billion gallons of water a year, at least as of 2022.57 Recent numbers are likely much higher. That’s equivalent to the total water consumption of Hong Kong, an alpha city of 8 million people.58 The indirect water footprint of the AI infrastructure boom is thus entangled across multiple global industries and supply chains.
Methodological Assumptions
The main goal in the rest of the piece is to calculate global energy consumption and GHG emissions specifically caused by AI diffusion and adoption, but first we need to articulate the major assumptions and theoretical frameworks guiding our analysis. There are no magical standards for measuring the energy and emissions footprint of a country or industry, and different organizations have used different standards over the years. Should we adopt partial substitution or the physical content method when measuring primary energy? How should we distribute consumption for geographically dispersed industries? If an airplane takes off in Paris and lands in New York, should the emissions from the airplane be assigned to France, the United States, both, or neither? What are the best ways of measuring emissions from land use changes? If you clear high-powered carbon sinks like peatlands and wetlands to build cities, palm plantations, or data centers, how should we measure the resulting emissions? What are the starting and final points of a lifecycle analysis? What stages in between should be included in the analysis? Where exactly do you draw the boundaries? You will get different answers depending on how you answer that question. These are just some among thousands of other important questions one could ask.
In this section, we are going to explain the major theoretical assumptions and practical choices guiding our calculations and how we arrived at our final figures, all of which are shown explicitly in the following section. Our decisions can certainly be questioned, precisely because in some cases there are different valid approaches and because in other cases we have broken new methodological ground in how we assess issues that people have been debating for decades. The first major assumption is that, with noted exceptions, we’re measuring the primary energy associated with AI, even though it’s definitely not a perfect metric. Nevertheless, we’re making this choice to be consistent with the way energy accounting is done by major international organizations, such as the International Energy Agency (IEA) and The Energy Institute. That means our AI-specific figures can be expressed as a share of the global total, thus allowing for additional context and comparisons.
Primary energy represents the direct use of energy sources without any prior conversions or transformations.59 Primary consumption includes activities like burning coal at a power plant and distilling crude oil at a refinery. Primary forms of energy are not useful on their own, so they are converted and transformed into secondary forms of energy. For example, we burn coal so we can turn the resulting steam energy into electricity, and we distill crude oil so we can produce gasoline. Coal and crude oil are primary forms of energy while electricity and gasoline are considered secondary forms. The secondary sources can also be converted into other tasks and end uses, collectively known as tertiary sources.
One of the chief theoretical struggles in primary energy accounting has been how to measure the energy consumption of renewable energy systems, like solar panels and wind turbines. There are two common methods of measuring primary energy: the partial-substitution method and the physical-energy content method.60 Let’s analyze them through some examples. When a power plant burns through coal, the primary energy simply equals the energy of the coal that goes up in flames. In the case of fossil fuels, then, things are pretty easy: record the amount of stuff we burn and call that primary energy. But the situation is more complicated for renewable energy sources, such as wind, solar, and hydropower, because nothing was burning while these energy sources generated electricity. Enter the two methods above.
In the physical-energy content method, we simply count the electrical energy produced by these sources as primary energy, even though electricity obviously qualifies as a converted form of energy. This is the method used by the International Energy Agency to measure energy consumption for renewables. In the partial-substitution method, we pretend that the produced electricity came from a hypothetical thermal power plant, and then we assume some efficiency rating for this plant. The idea behind the method is that the renewable energy sources are replacing a coal or gas plant that would’ve produced that same amount of electricity. For example, if the plant has a hypothetical efficiency of 20%, then we would multiply the electricity generated by the renewables with a factor of five. In this case, the primary energy required to produce that electricity is five times larger. The company British Petroleum historically adopted this partial-substitution method in its popular global energy annual reports, but after it handed over control over generating these reports to The Energy Institute, a British organization, the latter made the decision to switch over to physical content method as well, aligning with the UN and the IEA.61 The main reason why these differences matter is because they can lead to diverging estimates of energy consumption, especially for nations that rely heavily on renewables. For example, Norway’s energy consumption is roughly 60% higher when measured through the partial-substitution method, given its significant dependence on hydropower.62
Although we’re aiming to measure primary energy to be consistent with other organizations, there are major conceptual issues with this method of accounting, as explained by Erald Kolasi in The Physics of Capitalism.63 In that work, and in this Substack post, Kolasi explains how economic systems function like conversional networks (coronets for short), meaning they’re continuously converting energy into different forms through highly organized and stratified networks. This network view fundamentally destabilizes any rigid starting points and boundaries for energy analysis. It’s hard to say that burning the coal at the power plant is what’s really primary and fundamental when that coal had to be first mined, extracted, partially refined, and transported on-site before it could be used for anything. And that whole process of extraction and transportation depended on a whole array of other energy conversions and labor inputs, which were also embedded in a series of other conversions, and so on. Viewing economic systems as coronets highlights the interdependence of global supply chains and the importance of butterfly effects and non-linear dynamics in understanding their underlying energy systems. For that reason, we may adjust certain calculations over and above primary energy, and for certain sectors we may focus on downstream energy consumption while avoiding a full primary energy accounting. All of these situations are handled on a case-by-case basis as shown in the next section.
For the energy analysis, we adopt an aggregate hybrid lifecycle approach, meaning we conduct an input-output analysis across the various supply and industrial chains necessary to make AI operations a reality. Specifically, we assume that the final output of the process is the total energy consumed by data centers and other facilities in 2026, adjusted for the impact that can be specifically attributed to AI. Our goal is to estimate the total lifecycle energy consumption and GHG emissions from AI adoption and diffusion in 2026. Normally, one might measure or estimate energy consumption related to data centers and other facilities that happened in this year only. That would mean counting the electricity consumed by data centers in 2026, the steel and cement produced in 2026 for data centers, the water consumed in 2026 by the semiconductor industry while producing chips for data centers, the fiber optic cables laid down in 2026, and so on. Then one would attribute a portion of all this energy use to AI specifically, since not all data center capacity is geared towards AI.
But this method presents enormous challenges. One needs to determine the stage of completion for various data centers, power plants, and other facilities around the world, and to then disentangle the supply chains that are providing them with materials and resources. Obtaining the data for this kind of analysis is quite difficult, and so we therefore opted for a different approach on a case-by-case basis. For certain sectors, we’ll be able to estimate the 2026 footprint directly, like the primary energy required for data electricity consumption. For other sectors, we’ll infer their 2026 footprint through indirect means, usually by first calculating their lifecycle footprint and allocating a share of that overall total to this particular year. Industry analysts expect roughly 100 GW of new data center capacity to come online between now and 2030.64 JLL has estimated that over 35 GW of new data center capacity are under construction in North America alone as of 2026.65 These figures imply that at least 65 GW of data center capacity are under various stages of construction globally, over half the operational total in 2025. It’s clear from these numbers that the AI infrastructure boom is backloaded towards recent periods, which implies that a huge share of any sector-level lifecycle total is concentrated in 2025 and 2026.
And that’s only a small part of the story. The bigger part is that the latest data center components have far higher energy intensities than prior ones, considering the shift over the past few years towards liquid-powered cooling, high-performance microchips like GPUs, and other energy-intensive devices. For these reasons and the ones above, we’ll allocate somewhere between 50-60% of any total sector-level lifecycle footprint towards 2026 alone. This is the basic assumption that we’ll carry going forward in our analysis.
To estimate the GHG emissions associated with global AI diffusion, we decided to largely adopt the standards of the GHG Protocol, a widely used methodology.66 That means we aim to track Scope 1, Scope 2, and Scope 3 emissions, with certain caveats and adjustments that are explained along the way. The goal is to have a comprehensive lifecycle analysis of the emissions impact from all the global energy networks and industrial supply chains involved in creating and building the physical infrastructure necessary for AI deployment and diffusion.
Following the GHG Protocol ensures we don’t get lost in the weeds about carbon offsets or other greenwashing gimmicks from Big Tech. We count operational and lifecycle emissions and that’s it. Scope 1 emissions are direct emissions linked to core business or household activities. Think of the energy used by a manufacturing business in its factories to produce goods. Scope 2 emissions are indirect emissions associated with the energy generated to keep a company or household operational, like emissions required to generate electricity that companies and families use to keep the lights on. Scope 3 emissions are upstream and downstream emissions across the lifecycle chain. Think of the emissions caused by the employees of a large company as they drive to work. Those emissions are assigned to that company under the GHG Protocol, since the workplace schedules and requirements of the company are the fundamental reason why the employees are driving in the first place.
Our analysis breaks new ground in many areas that haven't received much attention, from land use change emissions caused by data center construction to downstream rebound effects from AI adoption. AI doesn't just live in data centers. It affects logistics, manufacturing, retail, banking, and so many other economic sectors around the world. For the first time ever, we're going to quantify the impact on many of these sectors on a global scale, while reiterating that we are by necessity making reasonable estimates and that these calculations must be understood accordingly.
Quantitative Analysis
In the sections below, we calculate the various AI-driven energy and emissions footprints of different industries and sectors, then we add up everything at the end to arrive at our global totals.
Primary Energy of Data Center Electricity Consumption
The International Energy Agency offers a wide array of assessments on what share of total data center capacity is devoted to AI operations and acknowledges the inherent uncertainty of determining this figure given the paucity of the available data.67 A widely quoted source is the Lawrence Berkeley National Laboratory’s flagship 2024 report on electricity demand from data centers, which suggested that roughly one-third of total data center capacity in the United States is devoted to AI, although with large uncertainties around the estimates.68 But regardless of the source, what nearly all of them have in common is that they track the amount of electricity consumed by GPU-accelerated servers, divide that by the total amount of electricity consumed by the data centers (or scale it with a facility-wide PUE, effectively the same thing), and call that the AI share of consumption. But this approach is very misleading for several reasons.
First, preparing the training data for AI model development, everything from text extraction and deduplication to labeling and tokenization, usually relies on CPU-powered servers and computers.69 Second, AI computing in modern data centers is widely distributed across various nodes and servers, requiring complex network switches to relay data across various servers. And moving all these signals also requires optical transceivers, which themselves consume lots of electricity. Third, scaling GPU loads with a standardized PUE ignores the non-linear dynamics of AI computing demands, which can exhibit extraordinary volatility. There are additional concerns as well, but they all lead to the same conclusion: the AI share of data center electricity consumption is much larger than what appears in traditional sources. This is especially true once we consider what’s coming down the pipeline in the next few years, when the majority of the growth in data center power demand is expected to be driven by AI workloads.70
Given the considerations above, we assume that 40% of global data center capacity is being devoted to AI. We acknowledge the inherent uncertainty around this assumption, and we think a great case can be made that the AI share should be even higher. In any case, it’s not a figure that can be definitively proven with the currently available data, in large part because hyperscalers and many other data center companies deliberately withhold and obscure the necessary information that would allow researchers to more accurately determine these distributions.
The average carbon intensity of the global electric grid is 460 grams of CO2-eq per kWh.71 Given the 788 TWh of global data center electricity use estimated below, the direct emissions from the data center sector would account for about 362 million metric tons of CO2 emissions in 2026, and the AI sector specifically comes out to roughly 145 million tons of CO2 emissions (40% of the data center total), an enormous sum equivalent to the annual emissions of roughly 30 million gas-powered cars.
There were roughly 12,000 operational data centers worldwide at the end of 2025, with a total global peak power capacity of roughly 122 GW as of Q1 2025 (equivalent to 122,000 MW), but we’ll assume 125 GW of capacity to account for the passage of time since Q1 of last year.72 For a narrow metric counting only commercial data center facilities, total data center energy consumption worldwide in 2025 has been estimated at roughly 470 TWh, though it’s rising quickly and, given current trajectories, will certainly be higher in 2026.73 A broader metric from S&P Global that includes micro data centers, enterprise server rooms, modular data centers, crypto facilities, and also accounts for the major inflection points in 2025, including the avalanche of AI-accelerated servers coming online, puts total global data center electricity consumption at 788 TWh in 2025.74 It’s this 788 TWh figure that will serve as our baseline starting point for global data center electricity consumption in 2026, simply because it's more accurate and comprehensive than the data from the IEA, which is largely focused on consumption from hyperscale and colocation data centers. Given our assumption that 40% of global data center capacity will go towards AI workloads in 2026, the estimated AI-driven component of global data center consumption is 315 TWh (40% of 788 TWh). Considering that overall global electricity consumption stands at roughly 32,000 TWh, our estimate puts the AI data center share alone at 1% of all global consumption.
The crypto industry itself has been estimated to annually consume roughly 140 TWh in electricity for Bitcoin mining.75 However, an increasing portion of this consumption is now covering AI workloads, as the crypto industry is making a concerted effort to shift additional capacity towards AI.76 The pinnacle of this structural shift was the $10 billion deal that Bitcoin miner IREN signed with Microsoft last year, agreeing to provide NVIDIA GPUs for high-performance AI computing needs.77 The sharp distinction that once existed between crypto mining facilities and commercial data centers is therefore rapidly evaporating, and for the first time ever it makes sense to lump them into the same category of electricity consumption. The estimated AI component of electricity consumption shown above thus implicitly includes the crypto sector as well.
The 315 TWh figure above is quite something, but it’s not the final answer. That’s because it takes upstream energy to produce electricity, and it’s this primary energy that we really care about. Since a major share of data center electricity is coming from coal and gas power plants as well as nuclear power plants, we need to determine the primary energy associated with that consumption. Based on global grid averages, 60% of global electricity was produced from fossil fuels, 31% from renewables, and 9% from nuclear power.78 We’re going to assume that this distribution holds for data center electricity use as well.
Now we can calculate the first major numbers we’ve been chasing all along. Of the 788 TWh globally, the mix above means that 473 TWh came from fossil fuels, 244 TWh came from renewables, and 71 TWh came from nuclear power. Based on prior research from the IEA, we’re going to assume a traditional efficiency of 36% for the fossil fuel plants and 33% for the nuclear plants.79 That implies the fossil fuel component of data center electricity consumption has a primary energy footprint of 1,314 TWh, the renewable component stays the same at 244 TWh (since we’re the using physical content method), and the nuclear component comes out to 215 TWh. In total, the global primary energy footprint of data center electricity use is 1,773 TWh. Allocating 40% of that total sum to AI means that AI-driven primary energy consumption for data center electricity use is 709 TWh globally. This is our first major concrete figure, and it’s already at 0.42% of total global energy consumption, since the latter stood at roughly 166,670 TWh in 2025, and we estimate will reach something like 168,000 TWh in 2026 to account for expected growth.80 Although this figure is a major component of the total quantity, we still have a long way to go.
Steel and Concrete
The global steel industry is responsible for roughly 7-9% of global GHG emissions, perhaps slightly more.81 Hyperscale data centers often require 10,000 metric tons of steel or more.82 However, the majority of the world’s data centers are not gargantuan facilities, so we assume that the average data center embodies roughly 2,000 metric tons of steel. According to the World Steel Association, producing every ton of steel leads to the emission of 2.18 metric tons of CO2-eq.83 And each ton of steel required 21.27 GJ of energy on average to produce.84 Using these numbers, we estimate total data center lifecycle emissions from steel at roughly 52 million metric tons and the total energy required for all that steel at 142 TWh. Allocating 40% to AI yields 57 TWh of energy and 21 million metric tons of emissions. For the 2026 footprint, we assume 60% of the lifecycle total, thus yielding 34 TWh and 13 million metric tons of emissions, respectively.
Data centers contain enormous amounts of concrete, which is a mixture of sand, gravel, water, and cement. The vast majority of concrete’s emissions footprint comes from the cement component, and so that’s what we’ll focus on. Based on industry reports in the United States, the typical American data center contains roughly 1,700 tons of embodied cement.85 But considering that the typical American data center is larger than the typical data center in the rest of the world, we assume that the global average of embodied cement per data center is roughly 1,200 tons. With 12,000 data centers, that implies a total lifetime cement footprint of just over 14 million tons. Using data from the EPA, which typically indicates that every ton of cement produced releases roughly 0.78 metric tons of CO2-eq gases, we estimate that the total lifecycle emissions footprint from data center cement is about 11.2 million metric tons.86
Metals and Materials
Data centers are full of metals, from copper and aluminum to tin and graphite. For example, copper is widely used for wiring and graphite is widely used for thermal management. Let’s start with copper as a small gateway to our broader analytic approach. Based on figures from data centers in the United States, we estimate that the average data center contains roughly 12 tons of copper per MW.87 With an estimated 133,000 MW of peak allocated capacity worldwide in 2026, that implies a total embodied copper footprint of 1.6 million tons.88 Based on lifecycle assessments performed for Chinese copper production, and accounting for improving efficiency in copper production, we estimate that it takes roughly 60 GJ to produce one ton of copper on average.89 Converting that to TWh for all the embodied copper in global data centers, the total lifecycle energy footprint comes out to roughly 25 TWh.
Data from the World Economic Forum shows that the typical metals footprint in data centers is roughly 70 tons per MW.90 To avoid performing a separate analysis for dozens of different metals and materials, we’re going to follow a similar approach like the one we explained for copper above, just at an aggregate level across all metals and materials. Given the total power capacity above, the final estimated mass footprint for the all the metals in global data centers is roughly 9.3 million tons, but we can take away the 1.6 million tons from copper above to avoid double-counting, so the real metals mass footprint for which we need to measure energy consumption and emissions is about 7.7 million tons.
Assuming an average production run of 50 GJ per ton, the total lifecycle energy footprint is 128 TWh. Adding that to the 25 TWh from copper gives a total of 153 TWh for the energy footprint of all data center metals worldwide. Allocating 40% of that total to AI leaves the AI share of the data center metals energy footprint at about 61 TWh. We again assume that 60% of the lifecycle total will come from this year alone, so 37 TWh of energy is allocated towards AI-driven metals and minerals production. We estimate the emissions footprint of this 37 TWh of energy at roughly 17 million metric tons of CO2-eq, by assuming that the carbon intensity of the global electric grid also applies to the carbon intensity of metals and minerals production.
Semiconductor Fabrication
Global silicon wafer shipments totaled almost 13,000 million square inches in 2025.91 It has been estimated that the lifecycle electricity intensity of semiconductor fabs is roughly 1.43 KWh per square centimeter.92 After converting to square centimeters, multiplying by 1.43, and converting from KWh to TWh, the total electricity footprint of semiconductor production in 2025 comes out to roughly 120 TWh. Considering total global electricity consumption was roughly 31,780 TWh in 2025, that means roughly 0.4% of the entire world’s electricity consumption is devoted just to producing semiconductors.93 We allocate 40% of this total to AI, so the AI share of semiconductor consumption is 48 TWh. The global CO2 emissions footprint of the semiconductor industry has been estimated at roughly 190 million metric tons for 2026.94 Allocating 40% of this total to AI means that the AI share of semiconductor emissions is roughly 76 million metric tons of CO2.
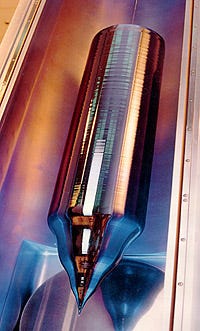
But we're certainly not done yet, because on-site electricity consumption is only one aspect of the semiconductor industry's energy and emissions footprint. For example, before any silicon wafers are processed in fabs, the wafers have to be produced in the first place, and that requires energy-intensive methods like the Czochralski process (see Figure 4). The Department of Energy has estimated that as much as 60% of an industry's manufacturing footprint lies upstream from direct on-site operations.95 We assume 60% for the semiconductor industry, meaning that its total global energy footprint comes out to 300 TWh in 2026. Deloitte has estimated that AI-focused chip sales alone will comprise roughly half of all semiconductor industry revenues in 2026.96 We shouldn’t allocate a full half of the energy footprint to AI on the basis of this result, since AI chip sales carry extraordinary profit margins based on limited supply and monopoly power. But we believe it’s reasonable to allocate 40% to it, especially because producing advanced semiconductors for the AI industry is far more energy-intensive than producing microcontrollers or other simpler devices. With that assumption, the AI-driven share of the semiconductor industry’s energy footprint in 2026 is 120 TWh. This is a large figure, but it's also likely conservative and understated.
Industrial Robotics
Robots are the pinnacle of physical AI (see Figure 5). There were about 4.6 million operational industrial robots globally in 2024.97 We estimate that roughly 5 million industrial robots are operating worldwide in 2026. Industry data from the previous decade shows that the average robot consumes roughly 22,000 kWh of electricity a year.98 Although it's true that newer robots have achieved greater power efficiency, the rise of lights-out manufacturing has also meant that they're running longer on average every single day, so we'll still use the average figure cited above. For 5 million robots, that unit-level average consumption implies roughly 110 TWh of aggregate global electricity consumption. Since the average carbon intensity of the global electric grid is 460 grams of CO2-eq per kWh, the total operational emissions footprint of industrial robots comes out to roughly 51 million metric tons of CO2-eq a year.
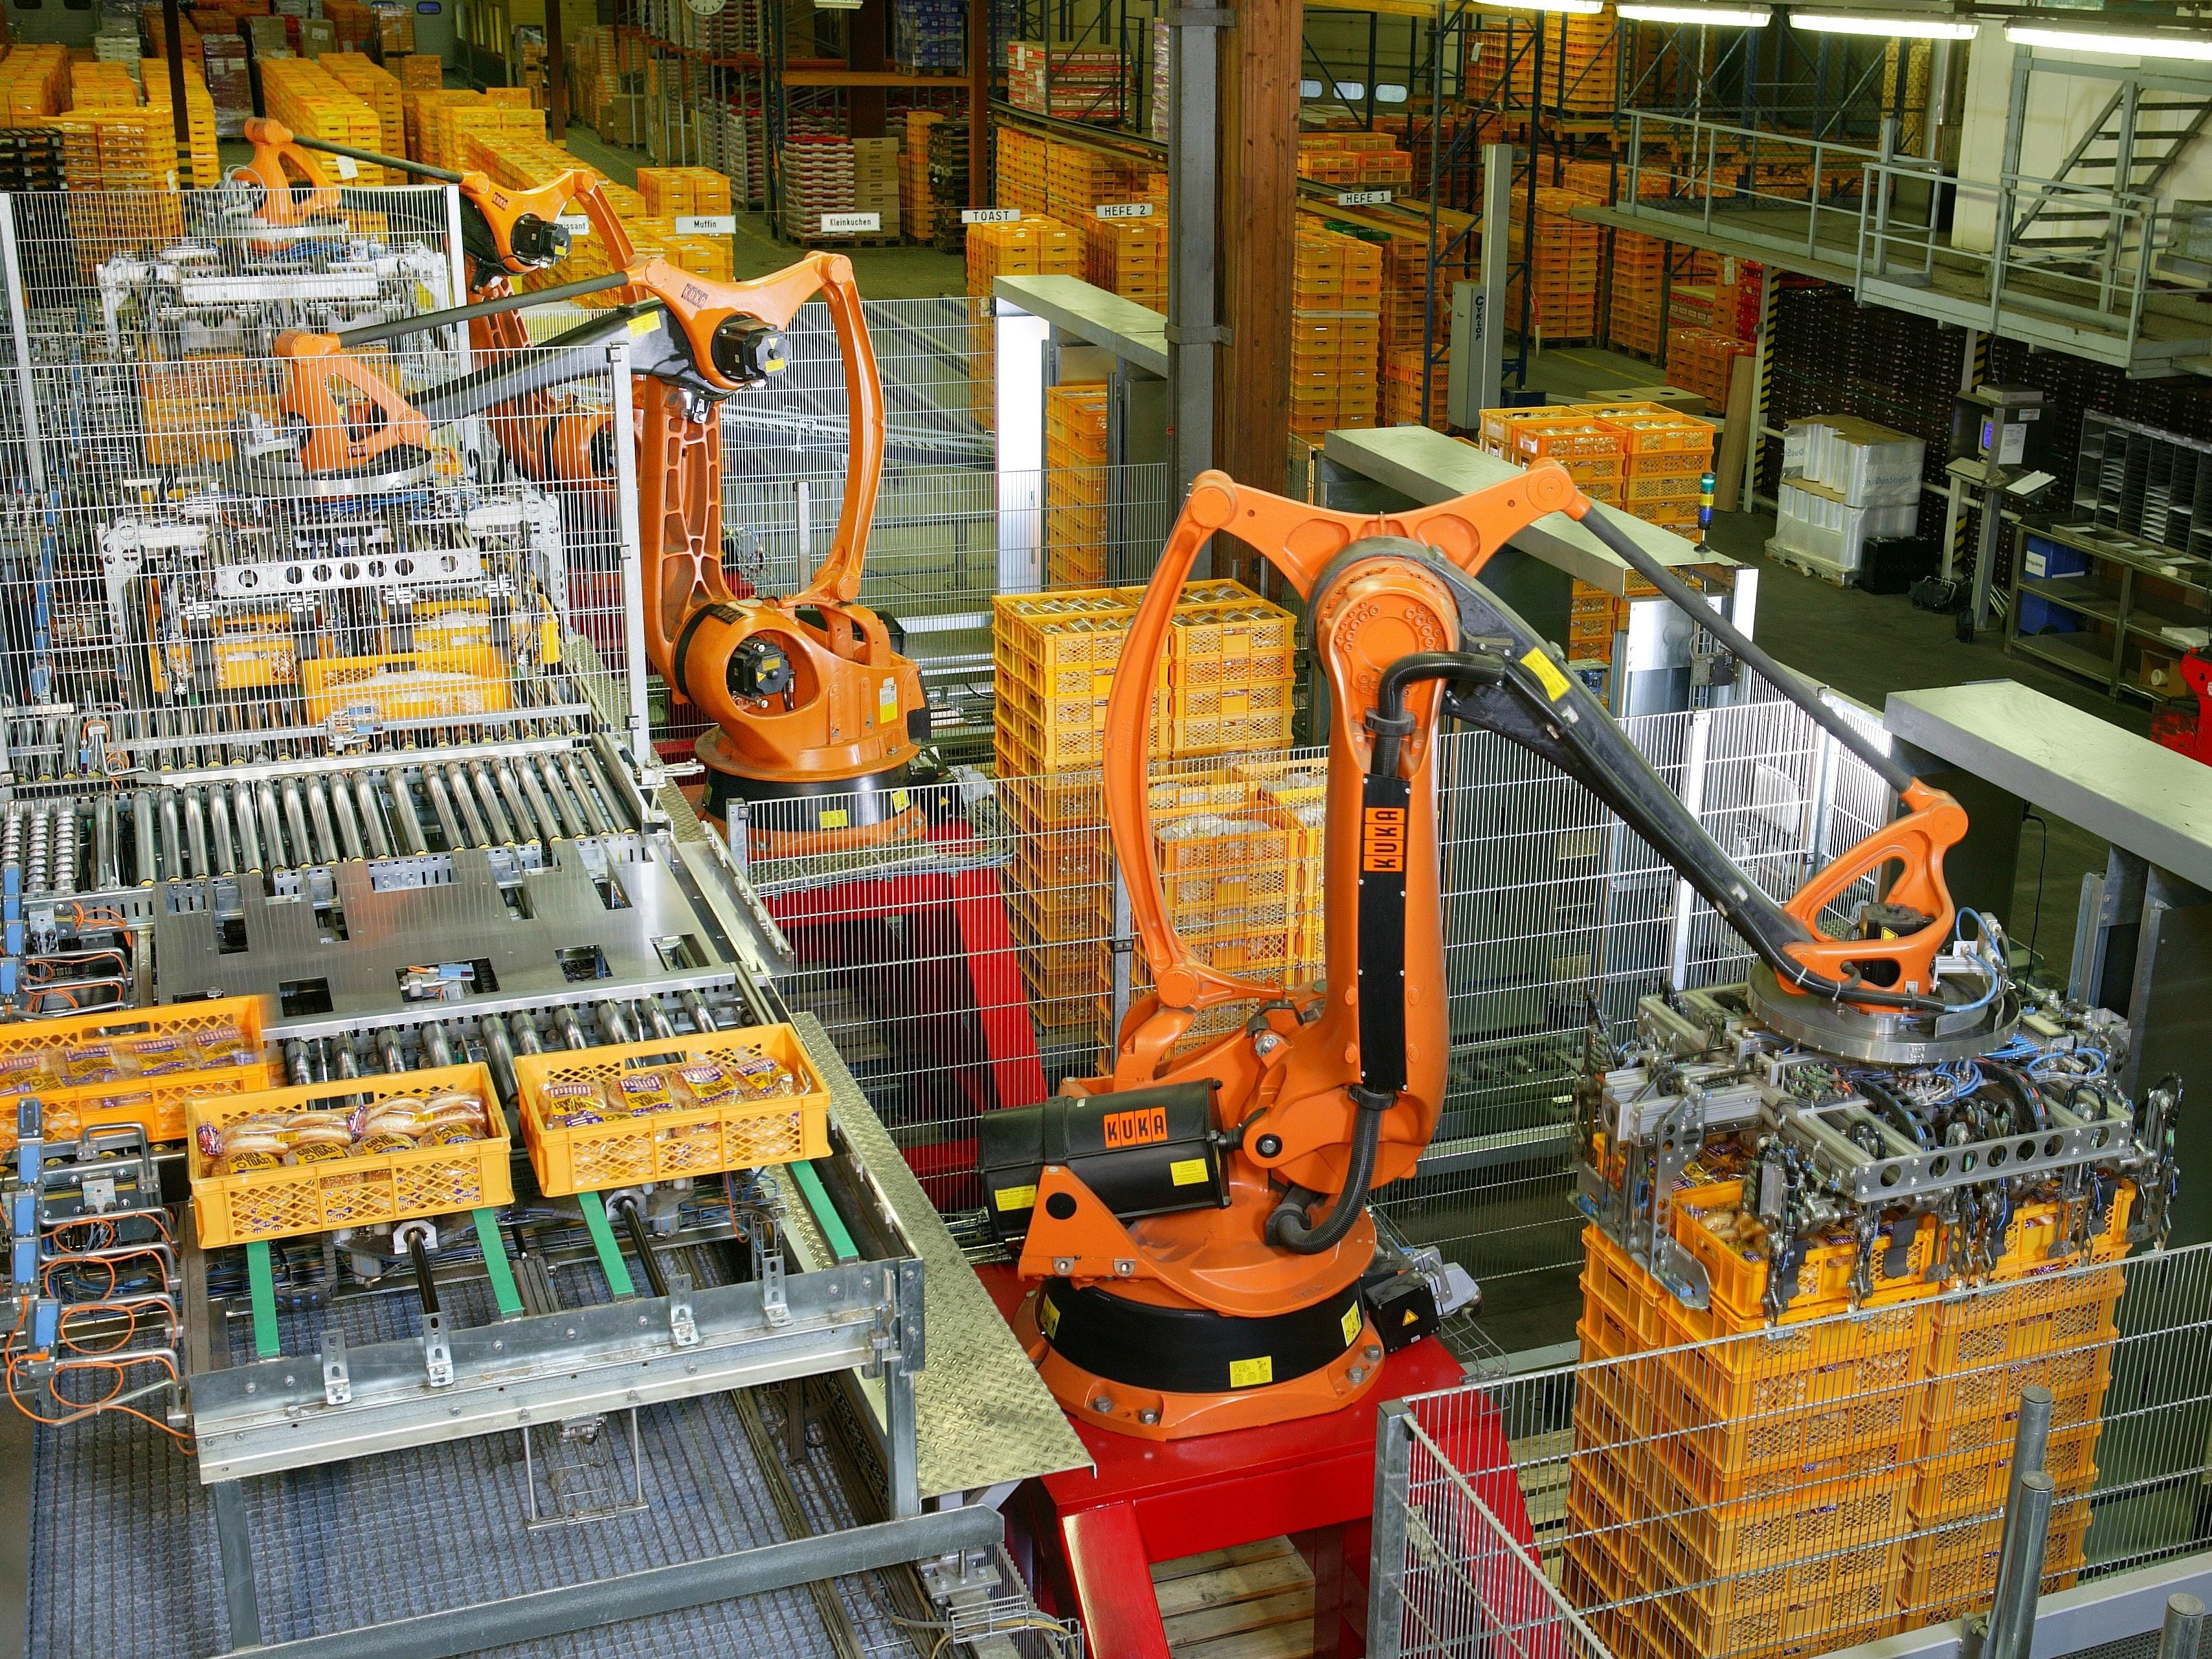
Assuming that robots and data centers are being powered by the same global fuel mix (see above), the primary energy associated with this electricity generation equals roughly 248 TWh. Since we define robots inherently as physical AI, this entire sum is included in the AI energy ledger. This is a staggering amount of energy that most people don’t think about when it comes to AI, because they’ve come to understand AI in very limited terms, as being just about neural networks and LLMs. Here we can see that even slightly broadening the range of the concept has major implications for how we assess its global energy and emissions footprint.
Transmission Networks and Telecommunications
In addition to data centers, data transmission networks involving cell towers, switching centers, and fiber-optic injection nodes also consume vast amounts of electricity, at least 360 TWh in 2025 if not much more.99 These networks are absolutely critical for AI workflows, since instructions to AI models could not be sent and answers could not be delivered to end users without them. Using Cisco data about the AI inference share of network traffic, we estimate that roughly 1% of this 360 TWh is devoted specifically for AI operations, meaning that AI deployments consume annually about 3 TWh of electricity worldwide through data transmission networks alone.100 It’s not a big number at all, but we did want to surface it for public attention because we expect it’s a number that’s going to rise rapidly over the next few years.
Transportation and Logistics
The manufacturing sectors powering the AI infrastructure buildout have globally extended supply chains. Minerals are first mined in a given location, then they might be shipped halfway around the world for refining, shipped somewhere else for final assembly, and the finished product then gets routed to halfway around the world again to be sold to consumers in a given country. The total transportation sector accounts for roughly 30% of global energy consumption, which comes to about 50,400 TWh for 2026.101 What we’re really interested in is freight and logistics, and that’s about 40% of the global transportation sector, or about 20,160 TWh in 2026.102 We assume that the global primary energy share for data center electricity use, roughly 1%, should also be allocated to this logistics energy footprint, so that means roughly 201 TWh of energy from the logistics industry in 2026 was devoted to shipping and moving material components and computer hardware for data centers, including steel, concrete, minerals, and microchips. Allocating 40% of that to AI implies that the AI-driven energy footprint for logistics in 2026 was about 80 TWh.
To perform a sanity check on this figure, we’ll pick an alternative methodology. Data centers had a total global power capacity of roughly 125,000 MW in 2025, and we’ll stick to this more conservative figure for the analysis rather than the 133,000 MW of capacity we estimate for 2026. A typical server rack draws about 1,000 W, so that implies 125 million hardware units, from server racks to storage arrays, are operating in global data centers as of this year.103 Research indicates that transporting a single server has an emissions footprint of roughly 25 kg of CO2-eq emissions.104 Transporting a heavier storage array takes up to 486 kg of CO2-eq emissions. We assume a blended average of 300 kg of CO2-eq emissions, which implies a total carbon footprint of 37.5 billion kg of CO2-eq emissions. We’ll take diesel fuel as our proxy for determining the freight energy footprint from these carbon emissions. Studies show that the emission factor of diesel is roughly 0.074 kg CO2/MJ, which in plain language means that burning 1 MJ of fuel releases 0.074 kg of carbon emissions.105 Another way of saying the same thing is that for every kilogram of carbon emitted, 13.5 MJ of energy are released. Given the carbon footprint above (37.5 billion kilograms), the total energy footprint comes out to about 506 billion MJ, which equals roughly 141 TWh.
This is somewhat lower than our official figure above, but at least they are both in the same ballpark. Our alternative methodology would likely yield a higher estimate if we accounted for the distribution of logistic channels, like what travels via air or rail or sea, and how long things are traveling in each of those components. Using the diesel emission factor from above, 80 TWh of energy consumption from the AI component of the freight and logistics industry would yield roughly 21 million metric tons of CO2-eq in annual emissions.
Renewable Energy Manufacturing
Older sources held that renewables provided just over 25% of data center global electricity consumption, but this share is almost certainly much higher for 2026, so we’ll stick to the 31% assumption used above.106 Considering that so many renewable energy systems are rapidly being built specifically to facilitate the expansion of data centers, it makes sense to include them as part of the lifecycle footprint of AI.107 While renewable systems like solar arrays and wind turbines have a negligible emissions footprint during their operational phase, it takes energy to produce them in the first place, and that manufacturing process does indeed release significant emissions. As we calculated at the top of the section, renewables were responsible for about 244 TWh of global data center electricity consumption.
Lifecycle assessments from 2024 suggested that the cumulative energy demand of average photovoltaics in the United States was roughly 13,000 MJ (oil-equivalent) per kW.108 Assuming that average figure holds globally and converting to TWh per GW, we get about 3.6 TWh per GW of lifecycle energy demand required to produce photovoltaics. According to the International Energy Agency, annual global additions of renewable energy capacity reached 800 GW in 2025, of which 75% came from solar alone.109 That implies 600 GW of new capacity was due to solar, and using the footprint cited above (3.6 TWh per GW), we estimate that 2,160 TWh of energy was required to produce all of these solar components. Using a very conservative footprint of 0.5 TWh per GW for the wind and battery systems together (the remaining 25%), we estimate it took roughly 100 TWh of energy to produce the new annual wind and battery capacity installed in 2025. The final tally for the lifecycle energy demand to produce all new renewable capacity installed in 2025 is 2,260 TWh. Rounding this out and accounting for further growth in 2026, we assume the total annual manufacturing energy footprint of renewable energy is 2,300 TWh.
Since US tech companies alone are driving almost 50 GW of new renewably energy capacity demand for data centers, it’s reasonable to assume that 60 GW of new renewable energy capacity is meant for data centers on a global basis, which is about 7.5% of the total 800 GW from above.110 Applying this percentage to the total renewable manufacturing footprint of 2,300 TWh yields 172 TWh. Allocating 40% of that to AI means that the AI-driven energy footprint of renewable energy manufacturing in 2026 is 70 TWh. Assuming that the same carbon intensity as the global grid average applies to this energy footprint, we estimate that AI-driven renewable energy emissions footprint for 2026 was roughly 32 million metric tons of CO2. A critical note of caution about this analysis: we have decided to exclude the upstream energy and emissions footprint of the roughly 80 GW of natural gas power plants under construction in the United States that are meant to support the data center expansion. There was too much noise and uncertainty in the data, and in any case this particular footprint will not be that large for 2026, probably no more than 20 TWh. However, we want to flag it as a major issue going forward, since these plants will consume vast amounts of energy once they become operational.
Land Use Change Emissions
Data centers have an enormous land footprint, and that land is usually occupied with plants and wildlife before construction begins. Many data centers are built on sensitive wetlands, marshes, and peatlands that store vast amounts of carbon dioxide. Ecologists estimate that the world's peatlands store twice as much carbon as all the world's forests put together, so building data centers in these ecologically sensitive areas is an especially terrible idea.111 When these pristine natural habitats are destroyed, the underlying carbon is suddenly exposed to atmospheric oxygen, triggering a wave of carbon dioxide emissions which can last for years. Damaged peatlands account for roughly 5% of all global anthropogenic CO2 emissions a year, so conserving them is of paramount importance for global ecology.112
Let’s begin our estimate of AI-driven land use change emissions at the 12,000 operational data centers in 2025. The largest hyperscale data centers can sometimes exceed 50 acres, but most data centers worldwide are much smaller (typically only a few acres). However, we're going to adopt a lifecycle perspective, so we'll also include the land footprint of renewable energy systems and natural gas power plants that are being constructed, or have been constructed, specifically to support the data center buildout. With this in mind, we’ll adopt an average land lifecycle footprint of 100 acres per data center in our analysis, which yields a total global land footprint of 1.2 million acres (or 486,000 hectares). In addition to the lifecycle off-site footprint, this global footprint includes not just the direct footprints of the facilities but also the land occupied by adjacent facilities and infrastructure, such as parking lots, retention ponds, and electrical substations.
To simplify our calculations, we’ll assume that all of this land was cleared evenly across the past 20 years, which we know is inaccurate as data center construction picked up significantly in the early 2020s. We’ll also assume for simplicity’s sake that that the total carbon sequestered in these affected environments enters the atmosphere at equal annual chunks across time, which is also inaccurate, as research has shown that about 50-60% of CO2 emissions in a particular year from forest conversions come specifically from land conversions that happened in that year.113 But as first approximations, these will do.
Next, we’ll assume that a typical hectare of land impacted by data center construction holds plants and soils that collectively sequester 450 metric tons of CO2, based on research studies about forest biomes and other environments.114 That implies an annual release of 22.5 tons of carbon dioxide per hectare per year from typical land and regular biomass. But peatlands are not regular by any definition. They store vastly more carbon than most plant biomes above ground, so we’ll assume they release roughly 45 tons of carbon dioxide per hectare per year (twice as much as the figure above for regular biomass). We’ll also assume that the data center buildout mirrors the characteristics of the global land surface, meaning that 3% of the data center land footprint is on peatland soils (14,600 hectares) and 97% of it is on regular land (471,400 hectares). Putting it all together, we see that land use change emissions from regular biomass contributed roughly 10.6 million tons of CO2 emissions in 2026 (471,400 multiplied by 22.5 from above) while land use emissions from the peatland component were roughly 660,000 tons of carbon dioxide (14,600 hectares multiplied by 45 from above). In sum, we estimate that global land use change emissions for 2026 as a result of data centers totaled roughly 11.3 million tons of CO2, an astonishing figure equivalent to the annual emissions of over two million cars.
Construction Industry Footprint
The construction industry is a major component of the AI-driven infrastructure buildout. Total US spending for data center construction will likely reach roughly $29 billion this year.115 Since the US has roughly half of the world’s data centers, we’ll assume total global spending will reach $59 billion. Average global energy intensity was roughly 3.87 MJ/USD in 2022.116 We’re going to assume it’s about 3 MJ/USD for the construction industry, so with that assumption we get an estimated 177 billion MJ for the global data center construction energy footprint in 2026, which comes out to 49 TWh. Allocating 40% to AI means the AI-driven data center construction energy footprint was 20 TWh in 2026. Since construction equipment like bulldozers, excavators, and tandem rollers overwhelmingly use diesel engines, which have an emissions intensity of about 265 grams of CO2 per kilowatt-hour (kWh) of energy (265,000 metric tons per TWh), that implies the total emissions footprint from data center construction in 2026 was about 13 million metric tons.117
Downstream Consumption and Rebound Effects
Up until now, we've been talking about the upstream factors necessary for AI diffusion: mining, industrial production, logistics, and so on. But we haven't yet considered the downstream effects. Once households, businesses, and governments adopt AI systems, they may also adopt different behaviors and strategies that require energy to implement. Although AI can be used to optimize smart grids and shipping routes, researchers like Lynn Kaak and others have pointed out that it can also be used to accelerate oil and gas exploration and extraction, along with other energy-intensive activities.118 The goal now is estimate the energy and emissions footprint associated with these downstream activities and rebound effects.
It’s abundantly clear from the research we already cited when we discussed the Jevons Paradox (also known as the backfire effect in economics) that capital-intensive industries usually produce rebound rates exceeding 100% over time. Thus, the real question isn’t if AI will lead to more downstream global energy use over time on a net basis, but how much. To get a sense for that, we need to first have a sense of the expected energy savings from AI deployment. Using data from GeSI, we adopt an abatement factor of 10 for our analysis, meaning that for every unit of energy consumed by the AI sector, we expect it to save 10 units of energy over the following five years in the absence of backfire effects.119 This gross abatement assumption is also supported by figures from the Boston Consulting Group, which estimated that AI could “mitigate 5% to 10% of global greenhouse gas emissions by 2030.”120 With a roughly 1% footprint, that would suggest a gross abatement of around 10. Of course, we do think that a strong backfire effect will materialize from global AI deployments, so the next task is to provide an estimate for it. Based on research for industrial sectors worldwide and in the United States, macroeconomic rebound effects can range anywhere from 110% to 800% over various timescales.121 We’re going to adopt a lower-end rebound rate of 140% over the following five years. This is actually a fairly conservative figure, given the rising entanglement of AI with virtually all industries and economic activities around the world; the real backfire effect over the following five years will likely be higher.
We use the following equation, where R is the estimated rebound effect (140%), to calculate the net extra energy consumption:
We estimated the global primary energy of AI electricity use at 709 TWh above. Per above, we use an abatement factor of 10 over the following 5 years. That means we expect AI to lead to global energy savings of roughly 7,100 TWh over the next five years. However, since AI deployment is expected to backfire, the net extra global energy consumption over the next five years is roughly 2,840 TWh, given the rebound formula above and the rebound rate of 140% (so R is 1.4). But we cannot naively add this to the total in 2026. It has to be annualized first, yielding 568 TWh of extra AI-driven energy consumption from the rebound effect in 2026. Using the average carbon intensity of the global electric grid from above (460 grams of CO2 per kWh, or 460,000 metric tons per TWh), we estimate the total emissions footprint of AI-driven rebound effects for 2026 at about 261 million metric tons of CO2.
It's true that rebound effects from any technological deployment generally don't scale in a linear way over time. There might be efficiency improvements at first and then the rebounds kick in towards the end of the observation period in question. That's likely the case with AI as well, so from that perspective it might seem unfair to allocate all of that 568 TWh to 2026. But we argue that this concern is mitigated by the fact that there are actual rebounds happening this year associated with AI deployments from prior years. AI didn’t magically start in 2026 with gigawatts of capacity appearing out of nowhere. The AI industry was already mature in many ways well before 2026, and all that diffusion has inevitably produced major rebounds by now.
One may object that these extra emissions we have calculated may have happened anyway, either partly or entirely, even if AI had never been invented. Suppose you have an idea of what to make for dinner and you ask an AI system about the ingredients, the recipe, which grocery store to go to, etc. Going to the store takes energy from your car, and also produces tailpipe emissions. Cooking the meal may require using a stove or oven, and they also consume energy and have an emissions footprint. The question then becomes: to what sector should these consequences be allocated? If your actions and behaviors are driven by the information you received from the AI system, we think there is a strong case to be made that the energy and emissions footprint should be allocated to AI. Of course, you may have driven to the grocery store to get the dinner ingredients even without using AI at all, and that activity may still have used up the same amount of energy and caused the same emissions. But that’s no problem at all. In that case, the energy and emissions footprint should be allocated to some other sector.
The fundamental issue isn’t just about the aggregate total, but about the allocation between the sectors that collectively determine that total. Simply put: if you did something because of AI, the energy and emissions footprint of that activity should be allocated to the AI sector, either as a downstream impact or a rebound effect. We understand that some researchers, including critics of the AI industry, may object to this conclusion, but we believe it’s fully consistent with established accounting standards from major international organizations, especially the GHG Protocol.
Final Results and Concluding Thoughts
Adding it all up, we estimate that the AI sector is responsible for almost 1,900 TWh of global energy consumption in 2026. And after accounting for additional factors that we did not explicitly analyze, like the construction of new electrical substations, robotic-centric warehouses, water reclamation facilities, and other infrastructure specifically designed to support the data center buildout, it’s likely that total AI-driven global energy demand is already closer to 2,000 TWh. Even at 1,900 TWh, the AI share of total global energy use in 2026 would be roughly 1.1%. We also estimate, after adding up all the sectoral numbers and landing at roughly 650 million metric tons of AI-driven CO2 emissions, that the AI share of global GHG emissions in 2026 stands at about 1.2%, with total annual global emissions sitting at roughly 55 gigatons of CO2-eq, albeit with a wide range of figures from EDGAR to UNEP (anywhere from 53 gigatons to 58 gigatons depending on a broad array of different assumptions). As we’ve discussed already, these numbers are much higher than many others in the media and academia have guessed on the basis of simplistic calculations and naïve assumptions.
The projections up to 2030 are obviously far worse and imply a catastrophic impact to global ecological stability. ChatGPT alone “processes approximately 2.5 billion prompts per day worldwide.”122 The scale of AI growth and diffusion globally is truly astounding, and the industry’s corresponding ecological footprint will soon rival that of major countries like India. It's not farfetched at all to think that the AI share of total global energy demand could rise to something like 5% by 2030, rivaling and in some cases surpassing the footprint of established dominant industries. The potential consequences of this extra resource pressure on biodiversity, global warming, freshwater scarcity, and biogeochemical cycles could be absolutely staggering and devastating for the stability of modern civilization.
There are a few factors that could alter this otherwise dreadful trajectory. First, political pressure could snowball and force the AI industry to stabilize or downscale. Second, in the absence of effective political pressure, the industry itself may slow down or self-implode if the scaling laws start breaking down. Third, investments may decline even if AI models continue making rapid progress, especially if the returns and profits just don’t show up, like they have failed to do for the major AI frontier companies so far. None of this means that AI goes away. At this point, it’s a permanent feature of our lives to various degrees. But it does mean that the AI infrastructure shockwave could slow down significantly, and with all the ecological challenges looming in the rest of the century, we argue that humanity must reconsider its priorities.
The latest infrastructure shockwave is already strongly contributing to global energy use and GHG emissions. At what point do societies or governments evaluate the long-term cost-benefit of this sector’s runaway growth? AI may one day be able to live up to the ideals espoused by its proponents, but that value is called into question today by the simple fact that it is also contributing to the conditions that will render Earth hostile—even uninhabitable—for billions in the coming years. Unless our societies and governments can cooperate and effectively regulate or control this industry, we worry that the entire human species will pay a heavy price.
Christian Bogmans et al., “Power Hungry: How AI Will Drive Energy Demand,” International Monetary Fund, April 22, 2025. https://www.elibrary.imf.org/view/journals/001/2025/081/article-A001-en.xml.
Article, “How Hyperscalers are Fueling the Race for 24/7 Clean Power,” McKinsey & Company, December 18, 2024. https://www.mckinsey.com/industries/electric-power-and-natural-gas/our-insights/how-hyperscalers-are-fueling-the-race-for-24-7-clean-power.
ASML, “Busting ASML myths,” 2022. https://www.asml.com/en/news/stories/2022/busting-asml-myths.
Sean M. Davis, “Implications of Taiwan’s dependence on imported energy,” Lehigh University, October 29, 2025. https://preserve.lehigh.edu/system/files/derivatives/coverpage/460057.pdf.
Arjen Y. Hoekstra, “The hidden water resource use behind meat and dairy,” Animal Frontiers, vol. 2, April 2012, pp. 3-8. https://academic.oup.com/af/article/2/2/3/4638610?login=false.
Miriam Aczel, et al., “Environmental Cost of AI’s Energy Use,” Institute for Water, Environment, and Health, United Nations, 2026. https://collections.unu.edu/eserv/UNU:10647/UNU-INWEH-Report-The_Env_Cost_of_AI-2026.pdf.
For a thorough discussion on these issues, see Google DeepMind, “From AGI to ASI,” June 12, 2026. https://deepmind.google/research/publications/239142/.
Hannah Ritchie, “How much energy do data centers and artificial intelligence use?”, Our World in Data, July 20, 2026. https://ourworldindata.org/how-much-energy-do-data-centers-and-artificial-intelligence-use.
Emma Strubell, Ananya Ganesh, and Andrew McCallum, “Energy and Policy Considerations for Deep Learning in NLP,” Proceedings of the 57th Annual Meeting of the Association for Computational Linguistics, Florence, Italy, Association for Computational Linguistics, pp. 3645–3650. https://aclanthology.org/P19-1355/.
For a major example, see James O’Donnell and Casey Crownhart, “We did the math on AI’s energy footprint.” MIT Technology Review. May 20, 2025. https://www.technologyreview.com/2025/05/20/1116327/ai-energy-usage-climate-footprint-big-tech/
Josie Stewart, Brooke Tanner, and Nicol Turner Lee, “As energy demands for AI increase, so should company transparency,” Brookings Institution, July 14, 2025. https://www.brookings.edu/articles/as-energy-demands-for-ai-increase-so-should-company-transparency/.
Udit Gupta et al., “Chasing Carbon: The Elusive Environmental Footprint of Computing,” 2021 IEEE International Symposium on High-Performance Computer Architecture, February 2021. https://ieeexplore.ieee.org/abstract/document/9407142.
Sasha Luccioni, Sylvain Viguier, and Anne-Laure Ligozat, “Estimating the Carbon Footprint of BLOOM, a 176B Parameter Language Model,” Journal of Machine Learning Research, 2023. https://www.jmlr.org/papers/v24/23-0069.html.
Alex de Vries, “The growing energy footprint of artificial intelligence,” Joule, vol. 7, October 18, 2023. https://www.cell.com/joule/fulltext/S2542-4351(23)00365-3.
Jesse Dodge et al., “Measuring the Carbon Intensity of AI in Cloud Instances,” Proceedings of the ACM Conference, on Fairness, Accountability, and Transparency, 1877-1894, June 20, 2022. https://dl.acm.org/doi/pdf/10.1145/3531146.3533234.
See Kate Crawford, Atlas of AI: Power, Politics, and the Planetary Costs of Artificial Intelligence (New Haven: Yale University Press, 2022).
Jonathan Kaiman, “Rare earth mining in China: the bleak social and environmental costs,” The Guardian, March 20, 2014. https://www.theguardian.com/sustainable-business/rare-earth-mining-china-social-environmental-costs.
Miguel Yañez-Barnuevo, “Data Center Energy Needs Could Upend Power Grids and Threaten the Climate,” Environmental and Energy Study Institute, April 15, 2025. https://www.eesi.org/articles/view/data-center-energy-needs-are-upending-power-grids-and-threatening-the-climate?hl=en-US.
Allan Chen, “Data center energy use: truth versus myth,” Berkeley Lab, July 16, 2002. https://www2.lbl.gov/Science-Articles/Archive/data-center-energy-myth.html?hl=en-US.
Peter L. Borland, Kevin McDonnell, and Mary Harty, “Assessment of the Potential to Use the Expelled Heat Energy from a Typical Data Centre in Ireland for Alternative Farming Methods,” Energies, vol. 16, 2023. https://www.mdpi.com/1996-1073/16/18/6704.
Huwan Peng et al., “Chiplet Cloud: Building AI Supercomputers for Serving Large Generative Language Models,” arXiv, 2023. https://arxiv.org/pdf/2307.02666.
Rich Miller, “Uptime Institute: The Average PUE is 1.8,” Data Center Knowledge, May 10, 2011. https://www.datacenterknowledge.com/uptime/uptime-institute-the-average-pue-is-1-8?hl=en-US.
Google. “Growing the Internet while reducing energy consumption,” Data Centers. https://datacenters.google/efficiency/?hl=en-US.
See John M Polimeni, Kozo Mayumi, Mario Giampietro, and Blake Alcott, The Myth of Resource Efficiency: The Jevons Paradox (New York: Taylor & Francis Group, 2009) pp. 141-172. Also see Richard York and Alexander McGee, “Understanding the Jevons Paradox,” Environmental Sociology, 2015. https://www.researchgate.net/profile/Julius-Mcgee/publication/285643149_Understanding_the_Jevons_paradox/links/5bdb72704585150b2b982762/Understanding-the-Jevons-paradox.pdf?_sg%5B0%5D=started_experiment_milestone&origin=journalDetail.
Robert B. Gordon. American Iron, 1607-1900 (Baltimore: John Hopkins University Press, 2001).
Vaclav Smil, Enriching the Earth: Fritz Haber, Carl Bosch, and the Transformation of World Food Production (Cambridge: MIT Press, 2001).
R Quentin Grafton et al., “The paradox of irrigation efficiency,” Science, vol. 361, 748-750, 2018. https://www.science.org/doi/abs/10.1126/science.aat9314.
Daiyaan Arfeen et al., “Nonuniform-Tensor-Parallelism: Mitigating GPU failure impact for Scaled-Up LLM Training,” arXiv, April 8, 2025. https://arxiv.org/abs/2504.06095.
Ibid.
For further details, see Carly Davenport et al., “AI, data centers, and the coming US power demand surge,” Goldman Sachs, April 28, 2024. https://www.goldmansachs.com/pdfs/insights/pages/generational-growth-ai-data-centers-and-the-coming-us-power-surge/report.pdf.
Jared Kaplan et al., “Scaling Laws for Neural Language Models,” arXiv, 2020. https://arxiv.org/pdf/2001.08361/1000.
Today in Energy, “Many newer power plants have cooling systems that reuse water,” U.S Energy Information Administration, February 11, 2014. https://www.eia.gov/todayinenergy/detail.php?id=14971.
Water Resources Mission Area, “Thermoelectric Power Water Use,” USGS, March 1, 2019. https://www.usgs.gov/mission-areas/water-resources/science/thermoelectric-power-water-use.
Executive Summary, “State of the Data Center,” AFCOM, 2026. https://cdn.ymaws.com/afcom.com/resource/resmgr/resource_center/whitepapers/afcom_stateofdatacenter26_ex.pdf.
Pengfei Li et al., “Making AI Less “Thirsty”: Uncovering and Addressing the Secret Water Footprint of AI Models,” arXiv, 2023. https://arxiv.org/pdf/2304.03271.
Pengfei Li et al., “Making AI Less Thirsty,” Communications of the ACM, vol. 68, 54-61. https://dl.acm.org/doi/full/10.1145/3724499?__cf_chl_f_tk=aT67DeeQZWK7Eun9sgl2ZplrYRA4U8X.MpTIk3l3Dfo-1783133058-1.0.1.1-QT25k9iDNKChv6P0mfhAZBb1izsPS5Cmxf56jAeeu3w.
Jon Gorey, “Data Drain: The Land and Water Impacts of the AI Boom,” Lincoln Institute of Land Policy, October 17, 2025. https://www.lincolninst.edu/publications/land-lines-magazine/articles/land-water-impacts-data-centers/.
Terry Nguyen and Ben Green, “What Happens When Data Centers Come To Town?”, University of Michigan, 2025. https://stpp.fordschool.umich.edu/sites/stpp/files/2025-07/stpp-data-centers-2025.pdf.
Heather Clancy, “Sip or guzzle? Here’s how Google’s data centers use water,” Trellis, November 22, 2022. https://trellis.net/article/sip-or-guzzle-heres-how-googles-data-centers-use-water/.
Md Abu Bakar Siddik, Arman Shehabi, and Landon Marston, “The environmental footprint of data centers in the United States,” Environmental Research Letters, vol. 16, May 21, 2021. https://iopscience.iop.org/article/10.1088/1748-9326/abfba1?_sp=b48260d8-0a7b-4784-9d4b-0e1ac60ee727.
Coca-Cola consumed roughly 300 billion liters of water every year, at least as of 2012, so the current totals are likely higher. See Andrea Ubreziova et al., “The Corporate Social Responsibility: The Case Study of Water as a Strategic Commodity For the Future,” 2012. https://real.mtak.hu/26194/1/Managing_SMEs_2012dec12-FINAL-DOI_CrossRef-Chapter_4.2.pdf. By 2014, at roughly the same period as the Coca-Cola figures above, US data centers consumed roughly 630 billion liters of water. See Lawrence Berkeley National Laboratory, “United States Data Center Energy Usage Report,” June 2016, https://www.osti.gov/servlets/purl/1372902/.
See Dario Amodei, “The Adolescence of Technology,” https://www.darioamodei.com/essay/the-adolescence-of-technology.
See Nicolas Bontigui and Dylan Patel, “From Tokens to Burgers: A Water Footprint Face-Off,” SemiAnalysis, January 15, 2026. Link to analysis is here.
Protect Our Aquifer, “xAI Supercomputer,” https://www.protectouraquifer.org/issues/xai-supercomputer.
Protect Our Aquifer, “xAI And Water Reuse,” https://www.protectouraquifer.org/now.
See “xAI Colossus,” Supermicro, https://www.supermicro.com/en/featured/xai-colossus. Also see Patrick Kennedy, “Inside the 100k GPU xAI Colossus Colossus Cluster That Supermicro Helped Build for Elon Musk,” https://www.supermicro.com/CaseStudies/Success_Story_xAI_Colossus_Cluster.pdf.
Julia Koslowsky, “How Are Data Centers Affecting the U.S. Power Grid?”, Insight Global, June 12, 2026. https://insightglobal.com/blog/how-data-centers-affect-us-power-grid/.
Diana DiGangi, “DOJ May Intervene in NAACP Lawsuit over xAI’s data center gas turbines,” Utility Dive, May 15, 2026. https://www.utilitydive.com/news/doj-may-intervene-in-naacp-lawsuit-over-xais-data-center-gas-turbines/820363/.
T. E. Norgate and R. R. Lovel, “Sustainable Water Use in Minerals and Metal Production,” Australasian Institute of Mining and Metallurgy, 2006. https://www.researchgate.net/publication/279549642_Sustainable_water_use_in_minerals_and_metal_production.
“How We Use Water,” Environmental Protection Agency. https://www.epa.gov/watersense/how-we-use-water.
John Kelly, Scott Pham, and Steve Reilly, “How much water does AI really use?”, CBS News, June 9, 2026. https://www.cbsnews.com/projects/2026/how-much-water-ai-uses/.
Yuelin Han et al., “Small Bottle, Big Pipe: Quantifying and Addressing the Impact of Data Centers on Public Water Systems,” arXiv, 2026. https://arxiv.org/abs/2603.02705.
Deanna Noel, “The Secret Data Center Buildout,” Public Citizen, July 8, 2026. https://www.citizen.org/news/the-secret-data-center-buildout-how-states-can-stop-big-techs-abuse-of-ndas/.
Will McCurdy, “Report: $130 Billion Worth of Data Center Projects Blocked in Q1 2026,” PCMag, June 14, 2026. https://www.pcmag.com/news/report-130-billion-worth-of-data-center-projects-blocked-in-q1-2026.
“Nature-related issues in the technology sector,” Taskforce on Nature-related Financial Disclosures. February 2026. https://tnfd.global/wp-content/uploads/2026/02/Case-study_Water-dependency-of-the-tech-sector_DIGITAL.pdf.
ArcGIS, “Taiwan Supply Chain,” Case Study 2023. https://experience.arcgis.com/experience/a1ec0d1276064ae387c863f2a14b11e1/page/Taiwan-Supply-Chain.
Shannon Davis, “Water Supply Challenges for the Semiconductor Industry,” Semiconductor Digest, October 24, 2022. https://www.semiconductor-digest.com/water-supply-challenges-for-the-semiconductor-industry/.
Theresa Wing Ling Lam et al., “Microplastic Contamination of Surface-Water Sourced Tap Water in Hong Kong—A Preliminary Study,” Applied Sciences, vol. 10, 2020. https://www.mdpi.com/2076-3417/10/10/3463.
See “Primary Energy Consumption,” Organization for Economic Cooperation and Development, November 20, 2001. For a list of things included under primary consumption in the United States, see the entry “Primary Energy Consumption” in the Glossary of the U.S. Energy Information Administration, https://www.eia.gov/tools/glossary/.
For an explanation of these methods, see “Statistics questionnaires” by the International Energy Agency. https://www.iea.org/statistics-questionnaires-faq.
Report, “Statistical Review of World Energy,” The Energy Institute, 2026, p. 81. https://www.energyinst.org/statistical-review.
Gregory Semieniuk and Isabella Weber, “Inequality in Energy Consumption: Statistical Equilibrium or a Question of Accounting Conventions?”, The European Physical Journal Special Topics, vol. 229, pp. 1705-1714, 2020. https://www.econstor.eu/bitstream/10419/227884/1/1681142201.pdf.
Erald Kolasi, The Physics of Capitalism (New York: Monthly Review Press, 2025), pp. 188-189.
“Data Center Growth Projections That Will Shape 2026-2030,” Avid Solutions, 2026. https://avidsolutionsinc.com/13-data-center-growth-projections-that-will-shape-2026-2030/.
Andrew Batson, “North American Data Center Report Year-End 2025,” JLL, February 17, 2026. https://www.jll.com/en-us/insights/market-dynamics/north-america-data-centers.
See “The Greenhouse Gas Protocol,” World Resources Institute. https://ghgprotocol.org/sites/default/files/standards/ghg-protocol-revised.pdf.
International Energy Agency, “Energy and AI,” 2024. https://www.iea.org/reports/energy-and-ai.
Lawrence Berkeley National Laboratory, “2024 United States Data Center Energy Usage Report,” Department of Energy. December 20, 2024. https://www.energy.gov/articles/doe-releases-new-report-evaluating-increase-electricity-demand-data-centers.
David Wood et al., “Data-Prep-Kit: getting your data ready for LLM application development,” arXiv, November 13, 2024. https://arxiv.org/pdf/2409.18164.
Vivian Lee et al., “Breaking Barriers to Data Center Growth,” Boston Consulting Group, January 20, 2025. https://web-assets.bcg.com/pdf-src/prod-live/breaking-barriers-data-center-growth.pdf.
Sagar Shelare et al., “Role of Geothermal Energy in Sustainable Water Desalination—A Review on Current Status, Parameters, and Challenges,” Energies, vol. 16, 2023. https://www.mdpi.com/1996-1073/16/6/2901.
Rasmus Leichter (2025). “Number of Data Centers by Country (November 2025)”. Retrieved from https://www.cargoson.com/en/blog/number-of-data-centers-by-country.
Presenc AI, “AI Data Center Energy Consumption Statistics 2026,” May 2026. https://presenc.ai/research/ai-data-center-energy-consumption-2026.
Report, “Statistical Review of World Energy,” The Energy Institute, 2026. https://www.energyinst.org/statistical-review.
Alexander Neumueller et al., “Cambridge Digital Mining Industry Report,” Cambridge Centre for Alternative Finance, University of Cambridge. https://www.jbs.cam.ac.uk/wp-content/uploads/2025/04/2025-04-cambridge-digital-mining-industry-report.pdf.
Cointelegraph, “Bernstein: Bitcoin minters becoming critical suppliers in AI infrastructure,” TradingView. https://www.tradingview.com/news/cointelegraph:e6666a483094b:0-bernstein-bitcoin-miners-becoming-critical-suppliers-in-ai-infrastructure.
IREN, “IREN Signs $9.7 Billion Agreement with Microsoft to Deploy AI Cloud Infrastructure,” November 3, 2025. ://iren.com/resources/blog/iren-signs97-billion-agreement-with-microsoft-to-deploy-ai-cloud-infrastructure.
Euan Graham, Nicolas Fulghum, and Katye Altieri, “Global Electricity Review 2025,” Ember, April 8, 2025. https://ember-energy.org/app/uploads/2025/04/Report-Global-Electricity-Review-2025.pdf.
For the nuclear efficiency factor, see “Statistics questionnaires” by the International Energy Agency. https://www.iea.org/statistics-questionnaires-faq. For the fossil fuel efficiency factor, see Peter Taylor et al., “Energy Efficiency Indicators for Public Electricity Production from Fossil Fuels,” International Energy Agency, July 2008. https://iea.blob.core.windows.net/assets/acaecb98-4430-4395-a4fa-d1a4d5ccb3d3/EnergyEfficiencyIndicatorsforPublicElectricityProductionfromFossilFuels.pdf.
Report, “Statistical Review of World Energy,” The Energy Institute, 2026, p. 23. https://www.energyinst.org/statistical-review.
Jinsoo Kim et al., “Decarbonizing the iron and steel industry: A systematic review of sociotechnical systems, technological innovations, and policy options,” Energy Research & Social Science, vol. 89, 2022. https://www.sciencedirect.com/science/article/abs/pii/S2214629622000706?.
World Economic Forum, “Metals at scale for AI at scale: securing the data center materials backbone,” December 10, 2025. https://www.weforum.org/stories/2025/12/securing-data-centre-materials/.
World Steel Association, “Climate change and the production of iron and steel,” https://worldsteel.org/climate-action/climate-change-and-the-production-of-iron-and-steel/.
World Steel Association, “Sustainability indicators of the steel industry,” https://worldsteel.org/data/world-steel-in-figures/world-steel-in-figures-2025/.
Camillo Schmidt-Chiari, “Global Cement Industry,” Gabelli, October 23, 2025. https://gabelli.com/research/global-cement-industry/.
Environmental Protection Agency, “U.S. Cement Industries Carbon Intensities,” October 2021. https://www.epa.gov/system/files/documents/2021-10/cement-carbon-intensities-fact-sheet.pdf.
World Economic Forum, “Metals at scale for AI at scale: securing the data center materials backbone,” December 10, 2025. https://www.weforum.org/stories/2025/12/securing-data-centre-materials/.
Andy Patrizio, “Gartner: Data center electricity consumption to grow 26% in 2026,” Network World, July 7, 2026. https://www.networkworld.com/article/4193996/gartner-data-center-electricity-consumption-to-grow-26-in-2026.html.
See Lingchen Liu et al., “Life Cycle Energy Consumption and GHG Emissions of the Copper Production in China and the Influence of Main Factors on the above Performance” Processes, vol. 19, 2022. https://www.mdpi.com/2227-9717/10/12/2715.
World Economic Forum, “Metals at scale for AI at scale: securing the data center materials backbone,” December 10, 2025. https://www.weforum.org/stories/2025/12/securing-data-centre-materials/.
SEMI, “Silicon Wafer Shipment Statistics,” https://www.semi.org/en/products-services/market-data/materials/si-shipment-statistics.
Shihcheng Hu and Yew Khoy Chuah, “Power consumption of semiconductor fabs in Taiwan,” Energy, vol. 28, 2003, 895-907. https://www.sciencedirect.com/science/article/abs/pii/S0360544203000082.
Nicolas Fulghum et al., “Global Electricity Review 2026,” Ember, April 21, 2026. https://ember-energy.org/app/uploads/2026/04/Global-Electricity-Review-2026.pdf.
Report, “Semiconductor Emissions Are Exploding: What the Forecast Says About AI, 3D NAND, and the Global Grid,” Tech Insights, December 22, 2025. https://www.techinsights.com/blog/semiconductor-emissions-are-exploding-what-forecast-says-about-ai-3d-nand-and-global-grid.
U.S. Department of Energy, “Using Life Cycle Energy Analysis for Sustainable Manufacturing,” 2026. https://www.energy.gov/cmei/amo/articles/using-life-cycle-energy-analysis-more-sustainable-manufacturing?hl=en-US.
Jeroen Kusters et al., “2026 Global Semiconductor Industry Outlook,” Deloitte, February 5, 2026. https://www.deloitte.com/us/en/insights/industry/technology/technology-media-telecom-outlooks/semiconductor-industry-outlook.html.
Executive Summary, “World Robotics 2025,” IFR, 2025. https://ifr.org/img/worldrobotics/Executive_Summary_WR_2025_Industrial_Robots.pdf.
Nate Barnett, Dave Costenaro, and Ingrid Rohmund, “Direct and Indirect Impacts of Robots on Future Electricity Load,” Applied Energy Group. https://www.aceee.org/files/proceedings/2017/data/polopoly_fs/1.3687904.1501159084!/fileserver/file/790278/filename/0036_0053_000029.pdf.
International Energy Agency, “Data Centers and Data Transmission Networks,” 2023. https://www.iea.org/energy-system/buildings/data-centres-and-data-transmission-networks.
Cisco Report 2026, “AI Impact on Wide Area Networks,” https://www.cisco.com/c/dam/en/us/solutions/collateral/artificial-intelligence/mass-scale-infrastructure/ai-network-traffic-report.pdf.
Lisa Winkler, “The effect of sustainable mobility transition policies on cumulative urban transport emissions and energy demand,” Nature Communications, vol. 14, 2023. https://www.nature.com/articles/s41467-023-37728-x.
Matteo Muratori et al., “Role of the Freight Sector in Future Climate Change Mitigation Scenarios,” Environmental Science & Technology, 2017. https://www.osti.gov/servlets/purl/1349019.
Taner Stewart, “Data Center Energy Consumption: How Much Electricity Does a Data Center Use?”, Texas Electric Broker, June 11, 2026. https://www.texaselectricbroker.com/blog/data-center-energy-consumption.
Tugana Aslan et al., “Toward climate neutral data centers: Greenhouse gas inventory, scenarios, and strategies,” CellPress, December 21, 2024. https://www.cell.com/action/showPdf?pii=S2589-0042%2824%2902864-5.
Nirmala Menikpura and Janya Sang-Arun, “Estimation Tool for Greenhouse Gas (GHG) Emissions from Municipal Solid Waste (MSW) Management in a Life Cycle Perspective,” Institute for Global Environmental Strategies, 2013. https://www.iges.or.jp/en/publication_documents/pub/data/en/3247/User_Manual_for_Simulation-_Version_II_%28edited%29-01_Oct_2013.pdf.
“Energy supply for AI,” International Energy Agency. https://www.iea.org/reports/energy-and-ai/energy-supply-for-ai.
Article, “How Hyperscalers are Fueling the Race for 24/7 Clean Power,” McKinsey & Company, December 18, 2024. https://www.mckinsey.com/industries/electric-power-and-natural-gas/our-insights/how-hyperscalers-are-fueling-the-race-for-24-7-clean-power.
Brittany L. Smith et al., “An Updated Life Cycle Assessment of Utility-Scale Solar Photovoltaic Systems Installed in the United States,” National Renewable Energy Laboratory, March 2024. https://docs.nlr.gov/docs/fy24osti/87372.pdf.
Report, “Global Energy Review 2026,” International Energy Agency, https://iea.blob.core.windows.net/assets/df903e1c-49c6-4757-8cbf-6fbcfe7611a0/GlobalEnergyReview2026.pdf.
Erhan Eren, “Gigawatt PPAs: How the Google-Total Energies Deal Redefined Hyperscaler Solar Procurement in 2026,” Enki, 2026. https://enkiai.com/solar/gigawatt-ppas-how-ai-redefined-hyperscaler-energy-in-2026/.
Christian Dunn and Chris Freeman, “Peatlands: our greatest source of carbon credits?”, Carbon Management, vol. 2, 2011. https://www.tandfonline.com/doi/full/10.4155/cmt.11.23.
Issue Brief, “Peatlands and climate change,” International Union for Conservation of Nature, 2017. https://iucn.org/resources/issues-brief/peatlands-and-climate-change?hl=en-US.
IPCC, “Land-Use Change & Forestry,” https://www.ipcc-nggip.iges.or.jp/public/gl/guidelin/ch5ref1.pdf.
Heather Keith, Brendan G. Mackey, and David B. Lindenmayer, “Re-evaluation of forest biomass carbon stocks and lessons from the world’s most carbon-dense forests,” Proceedings of the National Academy of Sciences, vol. 106, July 14, 2009. https://www.pnas.org/doi/10.1073/pnas.0901970106.
“How much is the US spending on building data centers?”, Our World in Data, April 9, 2026. https://ourworldindata.org/how-much-is-the-us-spending-on-building-data-centers.
ESMAP, “Energy Efficiency,” https://trackingsdg7.esmap.org/sites/default/files/download-documents/chapter4_energyefficiency.pdf.
“Carbon dioxide emission factors,” Our World in Data, https://ourworldindata.org/grapher/carbon-dioxide-emissions-factor.
Lynn H. Kaak et al., “Aligning artificial intelligence with climate change mitigation,” Nature Climate Change, 2022. https://par.nsf.gov/servlets/purl/10469824.
GeSI, “The Opportunity,” https://smarter2030.gesi.org/the-opportunity/.
Amane Dannouni et al., “Accelerating Climate Action with AI,” Boston Consulting Group, November 2023. https://web-assets.bcg.com/72/cf/b609ac3d4ac6829bae6fa88b8329/bcg-accelerating-climate-action-with-ai-nov-2023-rev.pdf.
Jeffrey B. Dahmus, “Can Efficiency Improvements Reduce Resource Consumption?”, Journal of Industrial Ecology, vol. 18, December 2014. https://web.mit.edu/ebm/www/Publications/JIE%20-%20Dahmus%20-%20Can%20Efficiency%20Improvements%20Reduce%20Resource%20Consumption%20-%202014%20copy.pdf
Miriam Aczel, et al., “Environmental Cost of AI’s Energy Use,” Institute for Water, Environment, and Health, United Nations, 2026. https://collections.unu.edu/eserv/UNU:10647/UNU-INWEH-Report-The_Env_Cost_of_AI-2026.pdf.
 | A guest post by
|